| Param | Original file | Final file |
|---|---|---|
| Filename | modeM0/AS1A05_104T04_9000003108cztM0_level2_bc.evt | modeM0/AS1A05_104T04_9000003108cztM0_level2_quad_clean.evt |
| Size (bytes) | 1,051,522,560 | 423,659,520 |
| Size | 1002.8 MB | 404.0 MB |
| Events in quadrant A | 7,018,093 | 2,687,604 |
| Events in quadrant B | 7,673,722 | 2,757,550 |
| Events in quadrant C | 6,794,319 | 2,617,249 |
| Events in quadrant D | 8,142,121 | 2,540,360 |
| Mode M0 | |||
|---|---|---|---|
| Quadrant | BADHDUFLAG | Total packets | Discarded packets |
| A | 0 | 67572 | 0 |
| B | 0 | 69692 | 0 |
| C | 0 | 68059 | 0 |
| D | 0 | 70813 | 0 |
| Mode M9 | |||
|---|---|---|---|
| Quadrant | BADHDUFLAG | Total packets | Discarded packets |
| A | 0 | 74 | 0 |
| B | 0 | 74 | 0 |
| C | 0 | 74 | 0 |
| D | 0 | 74 | 0 |
| Mode SS | |||
|---|---|---|---|
| Quadrant | BADHDUFLAG | Total packets | Discarded packets |
| A | 0 | 660 | 0 |
| B | 0 | 660 | 0 |
| C | 0 | 660 | 0 |
| D | 0 | 660 | 0 |
| Quadrant | Total seconds | Saturated seconds | Saturation percentage |
|---|---|---|---|
| A | 32456 | 174 | 0.536110% |
| B | 32456 | 278 | 0.856544% |
| C | 32456 | 408 | 1.257087% |
| D | 32456 | 329 | 1.013680% |
Noise dominated data is calculated using 1-second bins in cleaned event files. If a bin has >2000 counts, and if more than 50% of those come from <1% of pixels, then it is considered to be noise-dominated and hence unusable.
| Quadrant | # 1 sec bins | Bins with >0 counts | Bins with >2000 counts | High rate bins dominated by noise | Noise dominated (total time) | Noise dominated (detector-on time) | Marked lightcurve |
|---|---|---|---|---|---|---|---|
| A | 39801 | 32456 | 0 | 0 | 0.00% | 0.00% |  |
| B | 39801 | 32456 | 0 | 0 | 0.00% | 0.00% |  |
| C | 39801 | 32456 | 3 | 3 | 0.01% | 0.01% |  |
| D | 39801 | 32457 | 63 | 63 | 0.16% | 0.19% | 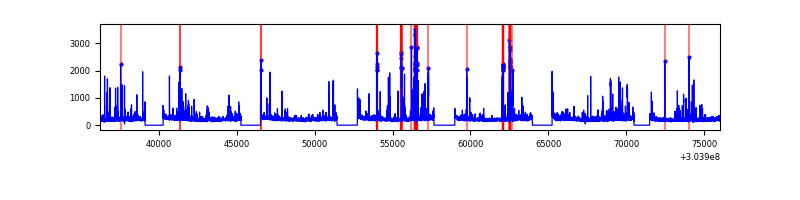 |
Top three noisy pixels from each quadrant. If the there are fewer than three noisy pixels in the level2.evt file, extra rows are filled as -1
| Pixel properties | Quadrant properties | ||||||
|---|---|---|---|---|---|---|---|
| Quadrant | DetID | PixID | Counts | Sigma | Mean | Median | Sigma |
| A | 13 | 254 | 36712 | 90.75 | 1811 | 1780 | 384.9 |
| A | 13 | 252 | 23404 | 56.17 | 1811 | 1780 | 384.9 |
| A | 8 | 160 | 15970 | 36.86 | 1811 | 1780 | 384.9 |
| B | 7 | 205 | 387093 | 1122.33 | 1842 | 1803 | 343.3 |
| B | 0 | 230 | 106908 | 306.16 | 1842 | 1803 | 343.3 |
| B | 0 | 183 | 28000 | 76.31 | 1842 | 1803 | 343.3 |
| C | 3 | 9 | 47599 | 112.56 | 1746 | 1741 | 407.4 |
| C | 9 | 54 | 32684 | 75.95 | 1746 | 1741 | 407.4 |
| C | 13 | 61 | 10067 | 20.44 | 1746 | 1741 | 407.4 |
| D | 1 | 52 | 674998 | 1682.07 | 1768 | 1711 | 400.3 |
| D | 13 | 172 | 252806 | 627.31 | 1768 | 1711 | 400.3 |
| D | 2 | 14 | 205843 | 509.98 | 1768 | 1711 | 400.3 |
Histogram calculated using DETX and DETY for each event in the final _common_clean file
| Quadrant A |  |
 |
Quadrant B |
|---|---|---|---|
| Quadrant D |  |
 |
Quadrant C |
| Plot type | Count rate plots | Images |
|---|---|---|
| Comparison with Poisson distribution Blue bars denote a histogram of data divided into 1 sec bins. Red curve is a Poisson curve with rate = median count rate of data. |
 |
 |
| Quadrant-wise count rates Data is divided into 100 sec bins |
 |
|
| Module-wise count rates for Quadrant A Data is divided into 100 sec bins |
 |
 |
| Module-wise count rates for Quadrant B Data is divided into 100 sec bins |
 |
 |
| Module-wise count rates for Quadrant C Data is divided into 100 sec bins |
 |
 |
| Module-wise count rates for Quadrant D Data is divided into 100 sec bins |
 |
 |
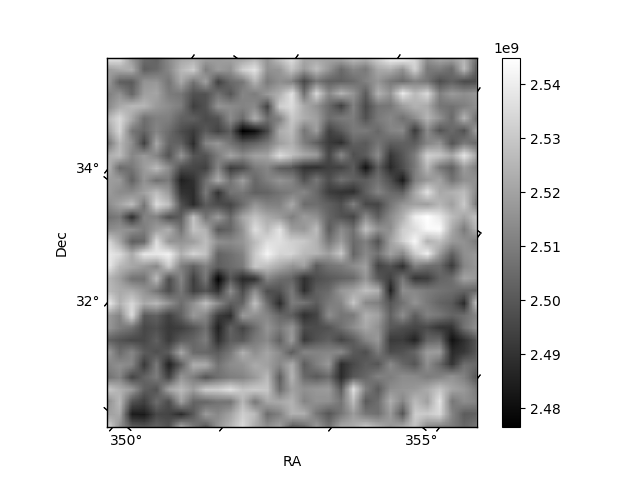
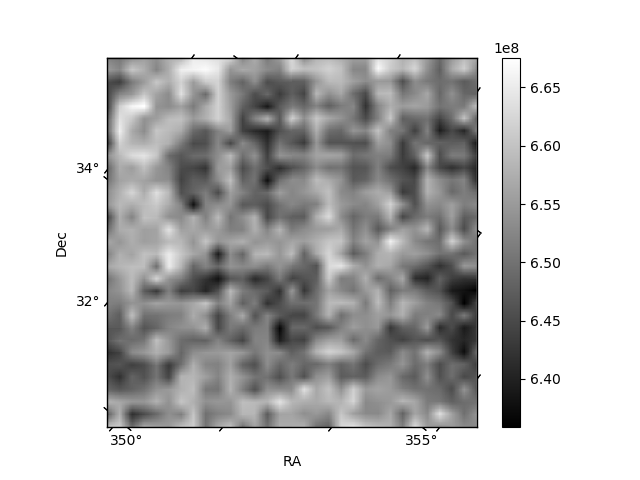
| Parameter | Plot |
|---|---|
| CZT HV Monitor | 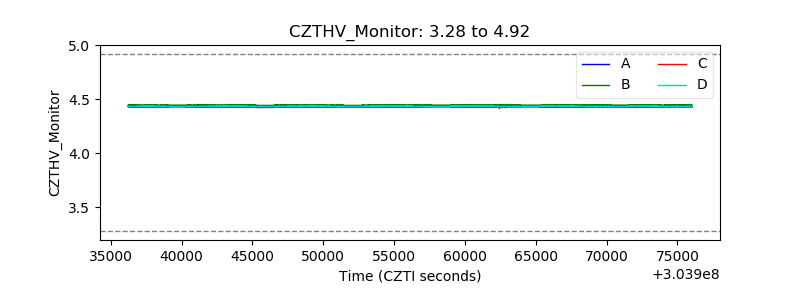 |
| D_VDD |  |
| Temperature 1 |  |
| Veto HV Monitor |  |
| Veto LLD | 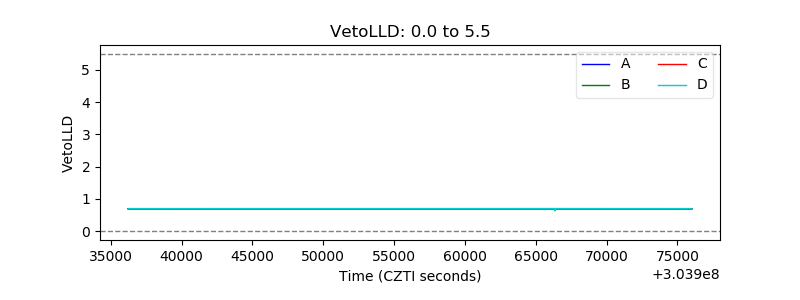 |
| Alpha Counter |  |
| _CPM_Rate |  |
| CZT Counter | 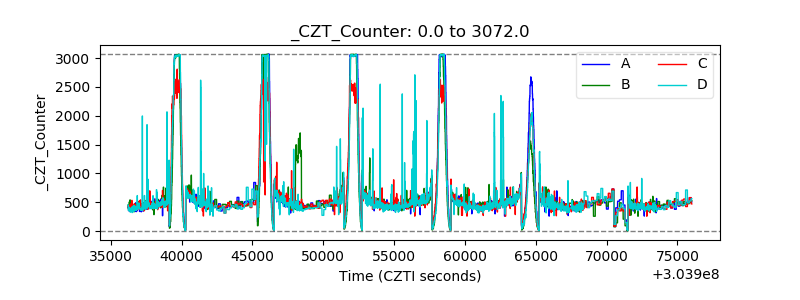 |
| +2.5 Volts monitor |  |
| +5 Volts monitor |  |
| _ROLL_ROT |  |
| _Roll_DEC |  |
| _Roll_RA |  |
| Veto Counter |  |