| Param | Original file | Final file |
|---|---|---|
| Filename | modeM0/AS1A05_088T02_9000003106cztM0_level2_bc.evt | modeM0/AS1A05_088T02_9000003106cztM0_level2_quad_clean.evt |
| Size (bytes) | 2,559,096,000 | 886,795,200 |
| Size | 2.4 GB | 845.7 MB |
| Events in quadrant A | 14,610,638 | 5,714,338 |
| Events in quadrant B | 18,099,361 | 5,701,715 |
| Events in quadrant C | 13,956,683 | 5,455,657 |
| Events in quadrant D | 26,064,746 | 5,188,567 |
| Mode M9 | |||
|---|---|---|---|
| Quadrant | BADHDUFLAG | Total packets | Discarded packets |
| A | 0 | 116 | 0 |
| B | 0 | 116 | 0 |
| C | 0 | 116 | 0 |
| D | 0 | 116 | 0 |
| Mode SS | |||
|---|---|---|---|
| Quadrant | BADHDUFLAG | Total packets | Discarded packets |
| A | 0 | 1424 | 0 |
| B | 0 | 1424 | 0 |
| C | 0 | 1424 | 0 |
| D | 0 | 1424 | 0 |
| Mode M0 | |||
|---|---|---|---|
| Quadrant | BADHDUFLAG | Total packets | Discarded packets |
| A | 0 | 144581 | 0 |
| B | 0 | 158287 | 0 |
| C | 0 | 144449 | 0 |
| D | 0 | 182605 | 0 |
| Quadrant | Total seconds | Saturated seconds | Saturation percentage |
|---|---|---|---|
| A | 70010 | 943 | 1.346950% |
| B | 70010 | 1763 | 2.518212% |
| C | 70010 | 1167 | 1.666905% |
| D | 70010 | 3696 | 5.279246% |
Noise dominated data is calculated using 1-second bins in cleaned event files. If a bin has >2000 counts, and if more than 50% of those come from <1% of pixels, then it is considered to be noise-dominated and hence unusable.
| Quadrant | # 1 sec bins | Bins with >0 counts | Bins with >2000 counts | High rate bins dominated by noise | Noise dominated (total time) | Noise dominated (detector-on time) | Marked lightcurve |
|---|---|---|---|---|---|---|---|
| A | 81375 | 70014 | 4 | 4 | 0.00% | 0.01% |  |
| B | 81375 | 70012 | 30 | 30 | 0.04% | 0.04% |  |
| C | 81375 | 70015 | 0 | 0 | 0.00% | 0.00% |  |
| D | 81375 | 70013 | 1375 | 1375 | 1.69% | 1.96% |  |
Top three noisy pixels from each quadrant. If the there are fewer than three noisy pixels in the level2.evt file, extra rows are filled as -1
| Pixel properties | Quadrant properties | ||||||
|---|---|---|---|---|---|---|---|
| Quadrant | DetID | PixID | Counts | Sigma | Mean | Median | Sigma |
| A | 6 | 16 | 155415 | 188.0 | 3742 | 3670 | 807.2 |
| A | 13 | 254 | 84647 | 100.32 | 3742 | 3670 | 807.2 |
| A | 0 | 226 | 24254 | 25.5 | 3742 | 3670 | 807.2 |
| B | 0 | 182 | 1146512 | 1621.53 | 3765 | 3674 | 704.8 |
| B | 7 | 220 | 764922 | 1080.11 | 3765 | 3674 | 704.8 |
| B | 0 | 189 | 601571 | 848.33 | 3765 | 3674 | 704.8 |
| C | 9 | 54 | 51839 | 56.68 | 3599 | 3577 | 851.4 |
| C | 10 | 91 | 22197 | 21.87 | 3599 | 3577 | 851.4 |
| C | 13 | 61 | 20776 | 20.2 | 3599 | 3577 | 851.4 |
| D | 1 | 52 | 9611743 | 11494.48 | 3596 | 3472 | 835.9 |
| D | 1 | 20 | 401635 | 476.33 | 3596 | 3472 | 835.9 |
| D | 12 | 233 | 382237 | 453.12 | 3596 | 3472 | 835.9 |
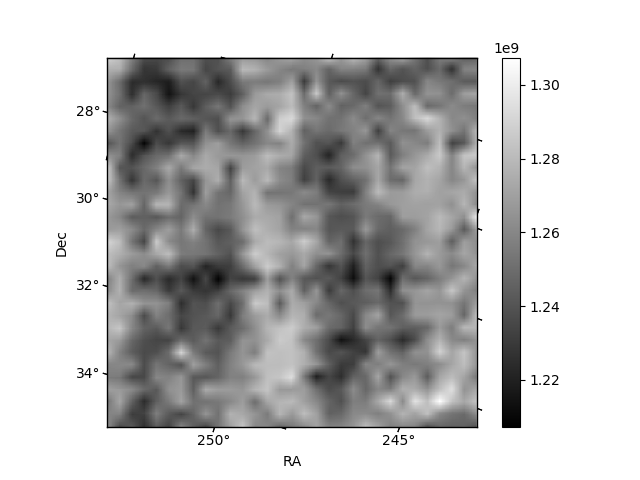
Histogram calculated using DETX and DETY for each event in the final _common_clean file
| Quadrant A |  |
 |
Quadrant B |
|---|---|---|---|
| Quadrant D |  |
 |
Quadrant C |
| Plot type | Count rate plots | Images |
|---|---|---|
| Comparison with Poisson distribution Blue bars denote a histogram of data divided into 1 sec bins. Red curve is a Poisson curve with rate = median count rate of data. |
 |
 |
| Quadrant-wise count rates Data is divided into 100 sec bins |
 |
|
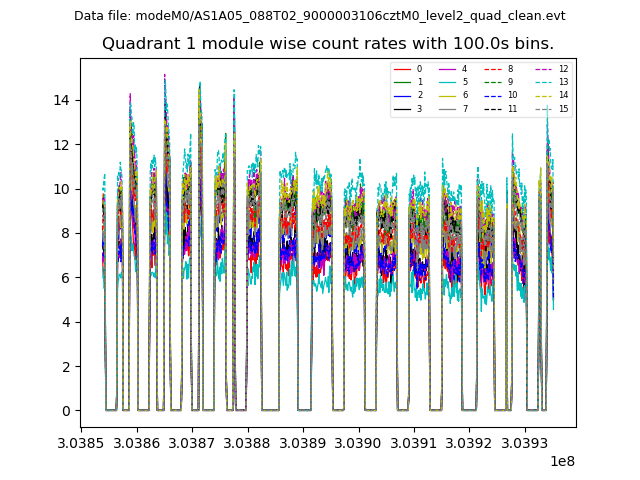
| Module-wise count rates for Quadrant A Data is divided into 100 sec bins |
 |
 |
| Module-wise count rates for Quadrant B Data is divided into 100 sec bins |
 |
 |
| Module-wise count rates for Quadrant C Data is divided into 100 sec bins |
 |
 |
| Module-wise count rates for Quadrant D Data is divided into 100 sec bins |
 |
 |
| Parameter | Plot |
|---|---|
| CZT HV Monitor |  |
| D_VDD |  |
| Temperature 1 |  |
| Veto HV Monitor |  |
| Veto LLD |  |
| Alpha Counter |  |
| _CPM_Rate |  |
| CZT Counter |  |
| +2.5 Volts monitor | 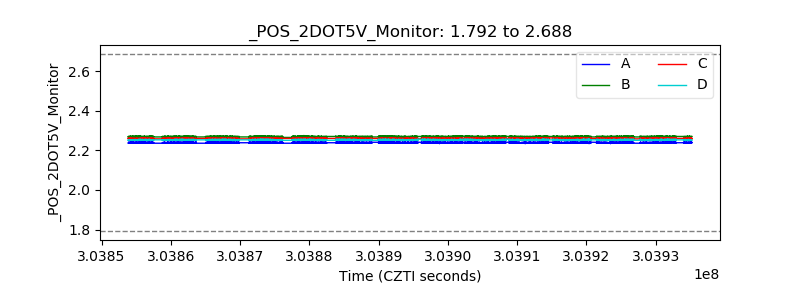 |
| +5 Volts monitor |  |
| _ROLL_ROT |  |
| _Roll_DEC |  |
| _Roll_RA | 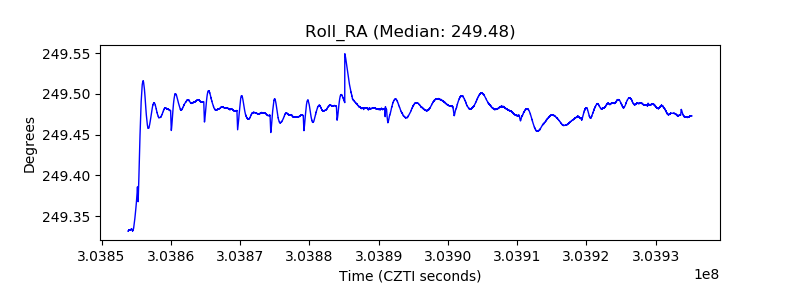 |
| Veto Counter |  |