| Param | Original file | Final file |
|---|---|---|
| Filename | modeM0/AS1A05_075T06_9000003104cztM0_level2_bc.evt | modeM0/AS1A05_075T06_9000003104cztM0_level2_quad_clean.evt |
| Size (bytes) | 2,012,806,080 | 788,567,040 |
| Size | 1.9 GB | 752.0 MB |
| Events in quadrant A | 11,793,411 | 5,118,611 |
| Events in quadrant B | 15,287,842 | 5,100,090 |
| Events in quadrant C | 12,694,816 | 4,904,233 |
| Events in quadrant D | 17,230,288 | 4,787,534 |
| Mode SS | |||
|---|---|---|---|
| Quadrant | BADHDUFLAG | Total packets | Discarded packets |
| A | 0 | 1182 | 0 |
| B | 0 | 1182 | 0 |
| C | 0 | 1182 | 0 |
| D | 0 | 1182 | 0 |
| Mode M9 | |||
|---|---|---|---|
| Quadrant | BADHDUFLAG | Total packets | Discarded packets |
| A | 0 | 89 | 0 |
| B | 0 | 89 | 0 |
| C | 0 | 89 | 0 |
| D | 0 | 89 | 0 |
| Mode M0 | |||
|---|---|---|---|
| Quadrant | BADHDUFLAG | Total packets | Discarded packets |
| A | 0 | 119011 | 0 |
| B | 0 | 133011 | 0 |
| C | 0 | 123761 | 0 |
| D | 0 | 135830 | 0 |
| Quadrant | Total seconds | Saturated seconds | Saturation percentage |
|---|---|---|---|
| A | 57940 | 634 | 1.094235% |
| B | 57940 | 1490 | 2.571626% |
| C | 57940 | 1346 | 2.323093% |
| D | 57940 | 1349 | 2.328271% |
Noise dominated data is calculated using 1-second bins in cleaned event files. If a bin has >2000 counts, and if more than 50% of those come from <1% of pixels, then it is considered to be noise-dominated and hence unusable.
| Quadrant | # 1 sec bins | Bins with >0 counts | Bins with >2000 counts | High rate bins dominated by noise | Noise dominated (total time) | Noise dominated (detector-on time) | Marked lightcurve |
|---|---|---|---|---|---|---|---|
| A | 66925 | 57942 | 0 | 0 | 0.00% | 0.00% | 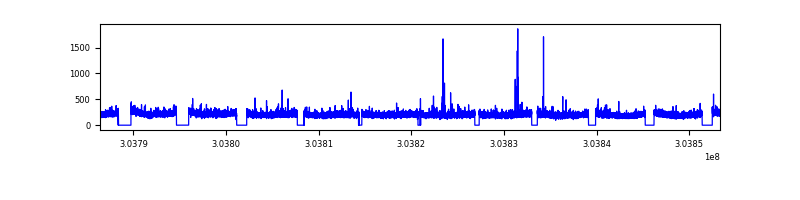 |
| B | 66925 | 57941 | 19 | 19 | 0.03% | 0.03% | 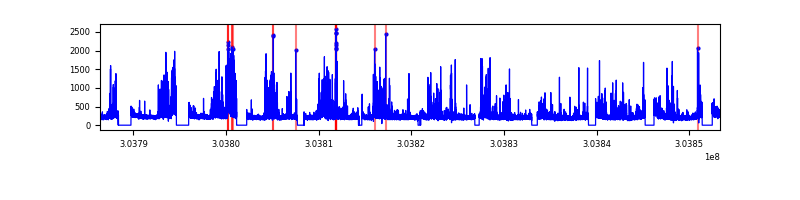 |
| C | 66925 | 57943 | 100 | 100 | 0.15% | 0.17% |  |
| D | 66925 | 57943 | 258 | 258 | 0.39% | 0.45% |  |
Top three noisy pixels from each quadrant. If the there are fewer than three noisy pixels in the level2.evt file, extra rows are filled as -1
| Pixel properties | Quadrant properties | ||||||
|---|---|---|---|---|---|---|---|
| Quadrant | DetID | PixID | Counts | Sigma | Mean | Median | Sigma |
| A | 13 | 254 | 58161 | 82.83 | 3031 | 2972 | 666.3 |
| A | 15 | 192 | 54347 | 77.11 | 3031 | 2972 | 666.3 |
| A | 10 | 229 | 20439 | 26.22 | 3031 | 2972 | 666.3 |
| B | 7 | 220 | 1061834 | 1834.07 | 3035 | 2963 | 577.3 |
| B | 0 | 182 | 981515 | 1694.95 | 3035 | 2963 | 577.3 |
| B | 0 | 189 | 492037 | 847.12 | 3035 | 2963 | 577.3 |
| C | 9 | 54 | 1355036 | 1969.3 | 2909 | 2894 | 686.6 |
| C | 10 | 91 | 104280 | 147.66 | 2909 | 2894 | 686.6 |
| C | 13 | 250 | 18009 | 22.01 | 2909 | 2894 | 686.6 |
| D | 1 | 52 | 2140833 | 3089.49 | 2976 | 2878 | 692.0 |
| D | 1 | 20 | 781213 | 1124.75 | 2976 | 2878 | 692.0 |
| D | 1 | 239 | 679204 | 977.34 | 2976 | 2878 | 692.0 |
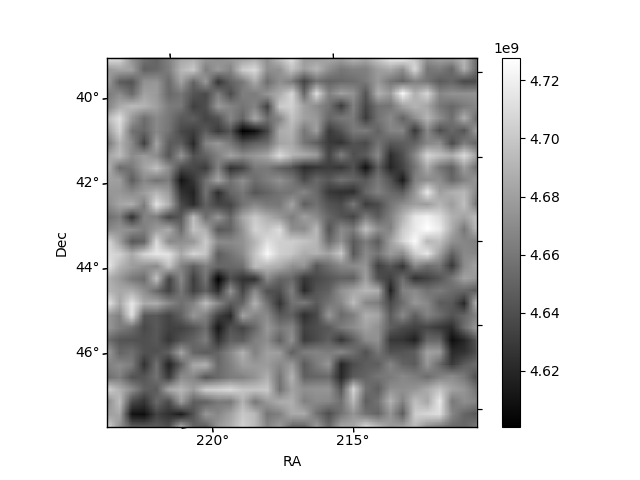
Histogram calculated using DETX and DETY for each event in the final _common_clean file
| Quadrant A |  |
 |
Quadrant B |
|---|---|---|---|
| Quadrant D |  |
 |
Quadrant C |
| Plot type | Count rate plots | Images |
|---|---|---|
| Comparison with Poisson distribution Blue bars denote a histogram of data divided into 1 sec bins. Red curve is a Poisson curve with rate = median count rate of data. |
 |
 |
| Quadrant-wise count rates Data is divided into 100 sec bins |
 |
|
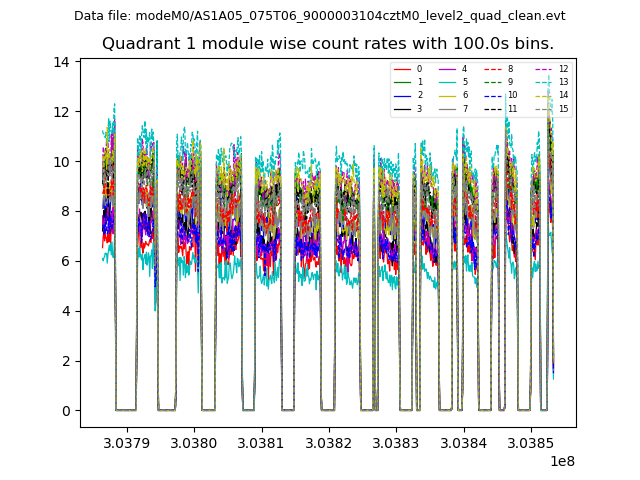
| Module-wise count rates for Quadrant A Data is divided into 100 sec bins |
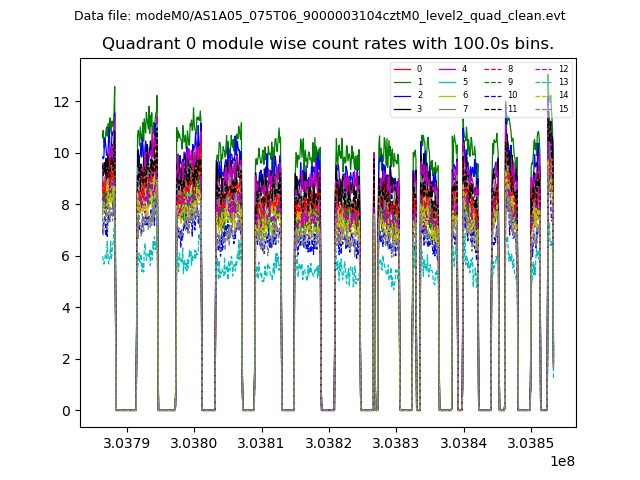 |
 |
| Module-wise count rates for Quadrant B Data is divided into 100 sec bins |
 |
 |
| Module-wise count rates for Quadrant C Data is divided into 100 sec bins |
 |
 |
| Module-wise count rates for Quadrant D Data is divided into 100 sec bins |
 |
 |
| Parameter | Plot |
|---|---|
| CZT HV Monitor |  |
| D_VDD |  |
| Temperature 1 | 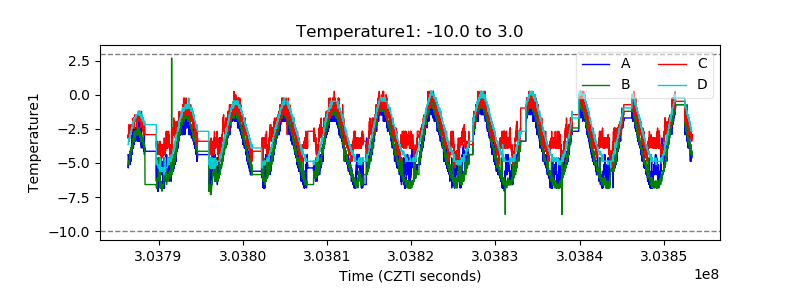 |
| Veto HV Monitor | 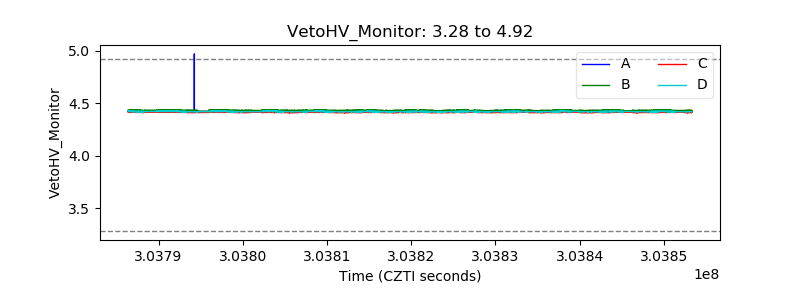 |
| Veto LLD | 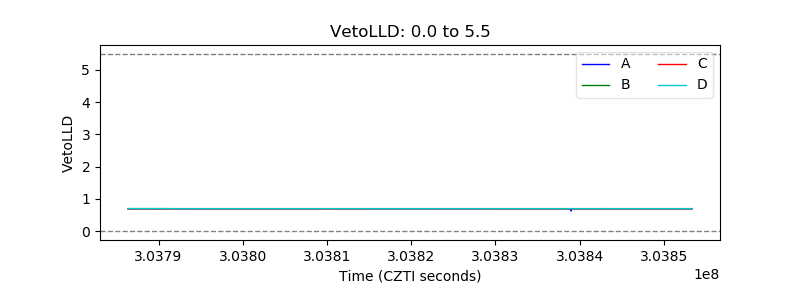 |
| Alpha Counter | 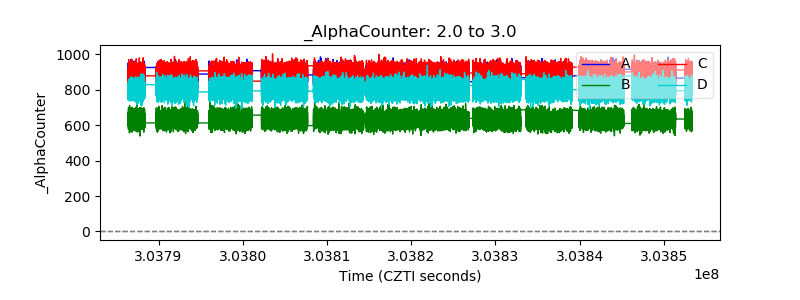 |
| _CPM_Rate |  |
| CZT Counter |  |
| +2.5 Volts monitor |  |
| +5 Volts monitor | 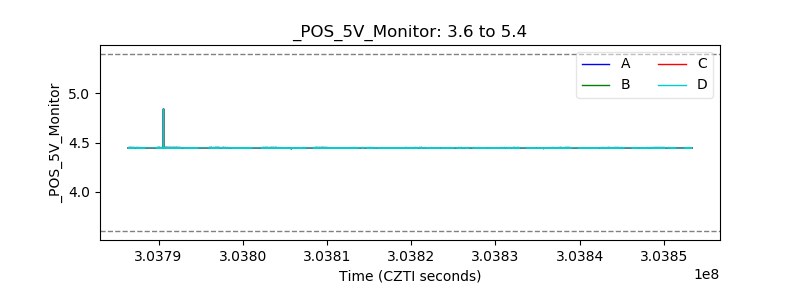 |
| _ROLL_ROT | 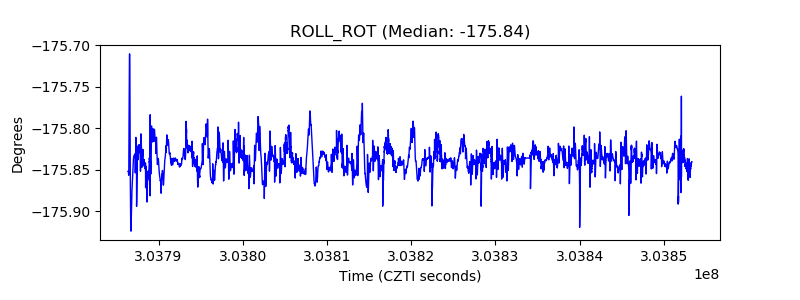 |
| _Roll_DEC |  |
| _Roll_RA |  |
| Veto Counter |  |