| Param | Original file | Final file |
|---|---|---|
| Filename | modeM0/AS1A06_009T03_9000003098cztM0_level2_bc.evt | modeM0/AS1A06_009T03_9000003098cztM0_level2_quad_clean.evt |
| Size (bytes) | 301,340,160 | 112,412,160 |
| Size | 287.4 MB | 107.2 MB |
| Events in quadrant A | 1,755,258 | 712,822 |
| Events in quadrant B | 2,213,154 | 714,239 |
| Events in quadrant C | 1,710,974 | 694,486 |
| Events in quadrant D | 2,832,423 | 665,506 |
| Mode SS | |||
|---|---|---|---|
| Quadrant | BADHDUFLAG | Total packets | Discarded packets |
| A | 0 | 180 | 0 |
| B | 0 | 180 | 0 |
| C | 0 | 180 | 0 |
| D | 0 | 180 | 0 |
| Mode M9 | |||
|---|---|---|---|
| Quadrant | BADHDUFLAG | Total packets | Discarded packets |
| A | 0 | 9 | 0 |
| B | 0 | 9 | 0 |
| C | 0 | 9 | 0 |
| D | 0 | 9 | 0 |
| Mode M0 | |||
|---|---|---|---|
| Quadrant | BADHDUFLAG | Total packets | Discarded packets |
| A | 0 | 18310 | 0 |
| B | 0 | 20352 | 0 |
| C | 0 | 18364 | 0 |
| D | 0 | 22071 | 0 |
| Quadrant | Total seconds | Saturated seconds | Saturation percentage |
|---|---|---|---|
| A | 8903 | 164 | 1.842076% |
| B | 8903 | 314 | 3.526901% |
| C | 8903 | 234 | 2.628328% |
| D | 8903 | 342 | 3.841402% |
Noise dominated data is calculated using 1-second bins in cleaned event files. If a bin has >2000 counts, and if more than 50% of those come from <1% of pixels, then it is considered to be noise-dominated and hence unusable.
| Quadrant | # 1 sec bins | Bins with >0 counts | Bins with >2000 counts | High rate bins dominated by noise | Noise dominated (total time) | Noise dominated (detector-on time) | Marked lightcurve |
|---|---|---|---|---|---|---|---|
| A | 9753 | 8903 | 0 | 0 | 0.00% | 0.00% |  |
| B | 9753 | 8903 | 0 | 0 | 0.00% | 0.00% |  |
| C | 9753 | 8903 | 0 | 0 | 0.00% | 0.00% | 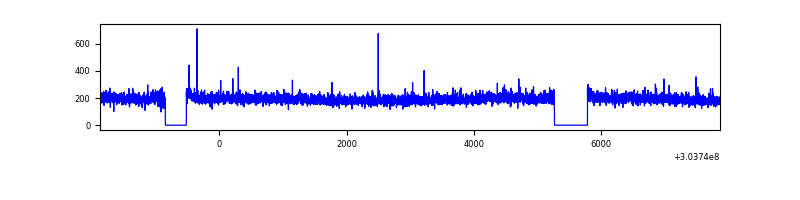 |
| D | 9753 | 8903 | 26 | 26 | 0.27% | 0.29% |  |
Top three noisy pixels from each quadrant. If the there are fewer than three noisy pixels in the level2.evt file, extra rows are filled as -1
| Pixel properties | Quadrant properties | ||||||
|---|---|---|---|---|---|---|---|
| Quadrant | DetID | PixID | Counts | Sigma | Mean | Median | Sigma |
| A | 13 | 254 | 3801 | 32.96 | 456 | 446 | 101.8 |
| A | 0 | 226 | 2894 | 24.05 | 456 | 446 | 101.8 |
| A | 12 | 194 | 2867 | 23.78 | 456 | 446 | 101.8 |
| B | 7 | 220 | 278061 | 3029.78 | 459 | 448 | 91.6 |
| B | 0 | 189 | 61198 | 663.01 | 459 | 448 | 91.6 |
| B | 0 | 230 | 24203 | 259.25 | 459 | 448 | 91.6 |
| C | 9 | 54 | 3343 | 27.1 | 443 | 438 | 107.2 |
| C | 7 | 247 | 2747 | 21.54 | 443 | 438 | 107.2 |
| C | 10 | 91 | 2614 | 20.3 | 443 | 438 | 107.2 |
| D | 9 | 1 | 674608 | 6362.45 | 445 | 428 | 106.0 |
| D | 15 | 0 | 118834 | 1117.43 | 445 | 428 | 106.0 |
| D | 13 | 104 | 69906 | 655.69 | 445 | 428 | 106.0 |
Histogram calculated using DETX and DETY for each event in the final _common_clean file
| Quadrant A |  |
 |
Quadrant B |
|---|---|---|---|
| Quadrant D |  |
 |
Quadrant C |
| Plot type | Count rate plots | Images |
|---|---|---|
| Comparison with Poisson distribution Blue bars denote a histogram of data divided into 1 sec bins. Red curve is a Poisson curve with rate = median count rate of data. |
 |
 |
| Quadrant-wise count rates Data is divided into 100 sec bins |
 |
|
| Module-wise count rates for Quadrant A Data is divided into 100 sec bins |
 |
 |
| Module-wise count rates for Quadrant B Data is divided into 100 sec bins |
 |
 |
| Module-wise count rates for Quadrant C Data is divided into 100 sec bins |
 |
 |
| Module-wise count rates for Quadrant D Data is divided into 100 sec bins |
 |
 |
| Parameter | Plot |
|---|---|
| CZT HV Monitor |  |
| D_VDD |  |
| Temperature 1 |  |
| Veto HV Monitor |  |
| Veto LLD |  |
| Alpha Counter | 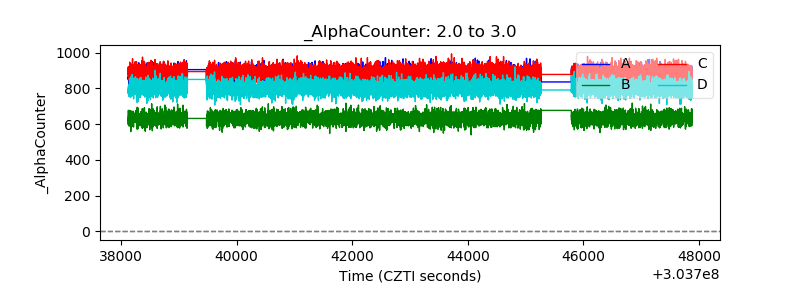 |
| _CPM_Rate |  |
| CZT Counter | 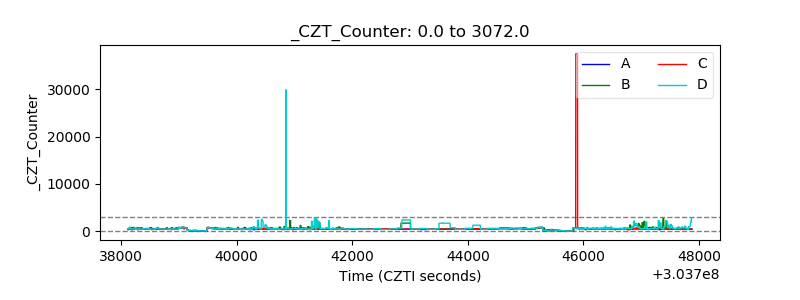 |
| +2.5 Volts monitor |  |
| +5 Volts monitor |  |
| _ROLL_ROT |  |
| _Roll_DEC | 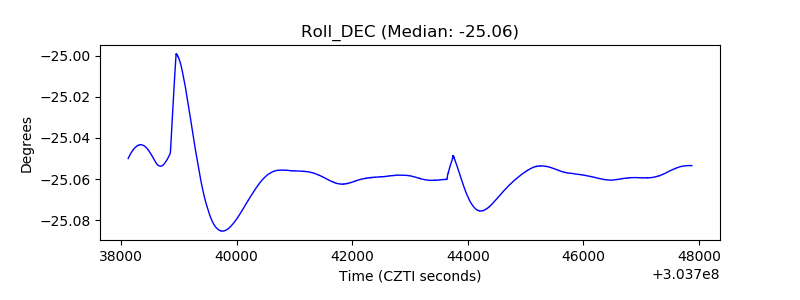 |
| _Roll_RA |  |
| Veto Counter |  |