| Param | Original file | Final file |
|---|---|---|
| Filename | modeM0/AS1A05_225T02_9000003100cztM0_level2_bc.evt | modeM0/AS1A05_225T02_9000003100cztM0_level2_quad_clean.evt |
| Size (bytes) | 559,488,960 | 214,225,920 |
| Size | 533.6 MB | 204.3 MB |
| Events in quadrant A | 2,947,553 | 1,377,666 |
| Events in quadrant B | 3,662,692 | 1,409,124 |
| Events in quadrant C | 2,937,170 | 1,380,699 |
| Events in quadrant D | 6,374,388 | 1,292,215 |
| Mode M0 | |||
|---|---|---|---|
| Quadrant | BADHDUFLAG | Total packets | Discarded packets |
| A | 0 | 30442 | 0 |
| B | 0 | 33487 | 0 |
| C | 0 | 30715 | 0 |
| D | 0 | 44025 | 0 |
| Mode SS | |||
|---|---|---|---|
| Quadrant | BADHDUFLAG | Total packets | Discarded packets |
| A | 0 | 300 | 0 |
| B | 0 | 300 | 0 |
| C | 0 | 300 | 0 |
| D | 0 | 300 | 0 |
| Mode M9 | |||
|---|---|---|---|
| Quadrant | BADHDUFLAG | Total packets | Discarded packets |
| A | 0 | 27 | 0 |
| B | 0 | 27 | 0 |
| C | 0 | 27 | 0 |
| D | 0 | 27 | 0 |
| Quadrant | Total seconds | Saturated seconds | Saturation percentage |
|---|---|---|---|
| A | 14917 | 99 | 0.663672% |
| B | 14917 | 200 | 1.340752% |
| C | 14917 | 177 | 1.186566% |
| D | 14917 | 1227 | 8.225515% |
Noise dominated data is calculated using 1-second bins in cleaned event files. If a bin has >2000 counts, and if more than 50% of those come from <1% of pixels, then it is considered to be noise-dominated and hence unusable.
| Quadrant | # 1 sec bins | Bins with >0 counts | Bins with >2000 counts | High rate bins dominated by noise | Noise dominated (total time) | Noise dominated (detector-on time) | Marked lightcurve |
|---|---|---|---|---|---|---|---|
| A | 17492 | 14917 | 0 | 0 | 0.00% | 0.00% |  |
| B | 17492 | 14917 | 0 | 0 | 0.00% | 0.00% |  |
| C | 17492 | 14917 | 0 | 0 | 0.00% | 0.00% |  |
| D | 17492 | 14916 | 199 | 199 | 1.14% | 1.33% |  |
Top three noisy pixels from each quadrant. If the there are fewer than three noisy pixels in the level2.evt file, extra rows are filled as -1
| Pixel properties | Quadrant properties | ||||||
|---|---|---|---|---|---|---|---|
| Quadrant | DetID | PixID | Counts | Sigma | Mean | Median | Sigma |
| A | 13 | 254 | 10467 | 57.55 | 761 | 746 | 168.9 |
| A | 10 | 229 | 6450 | 33.77 | 761 | 746 | 168.9 |
| A | 8 | 6 | 5572 | 28.57 | 761 | 746 | 168.9 |
| B | 0 | 182 | 217343 | 1433.8 | 770 | 751 | 151.1 |
| B | 7 | 220 | 158256 | 1042.66 | 770 | 751 | 151.1 |
| B | 0 | 189 | 74759 | 489.92 | 770 | 751 | 151.1 |
| C | 9 | 54 | 57505 | 319.08 | 746 | 741 | 177.9 |
| C | 10 | 91 | 6967 | 35.0 | 746 | 741 | 177.9 |
| C | 7 | 247 | 5250 | 25.35 | 746 | 741 | 177.9 |
| D | 1 | 52 | 1211015 | 6997.64 | 733 | 708 | 173.0 |
| D | 9 | 1 | 815017 | 4708.1 | 733 | 708 | 173.0 |
| D | 2 | 16 | 694022 | 4008.54 | 733 | 708 | 173.0 |
Histogram calculated using DETX and DETY for each event in the final _common_clean file
| Quadrant A |  |
 |
Quadrant B |
|---|---|---|---|
| Quadrant D |  |
 |
Quadrant C |
| Plot type | Count rate plots | Images |
|---|---|---|
| Comparison with Poisson distribution Blue bars denote a histogram of data divided into 1 sec bins. Red curve is a Poisson curve with rate = median count rate of data. |
 |
 |
| Quadrant-wise count rates Data is divided into 100 sec bins |
 |
|
| Module-wise count rates for Quadrant A Data is divided into 100 sec bins |
 |
 |
| Module-wise count rates for Quadrant B Data is divided into 100 sec bins |
 |
 |
| Module-wise count rates for Quadrant C Data is divided into 100 sec bins |
 |
 |
| Module-wise count rates for Quadrant D Data is divided into 100 sec bins |
 |
 |
| Parameter | Plot |
|---|---|
| CZT HV Monitor |  |
| D_VDD |  |
| Temperature 1 |  |
| Veto HV Monitor |  |
| Veto LLD |  |
| Alpha Counter |  |
| _CPM_Rate |  |
| CZT Counter | 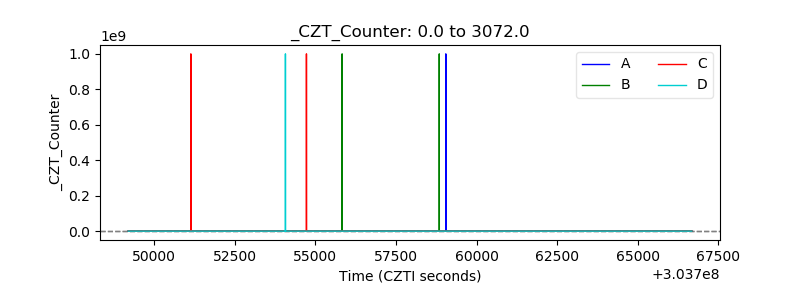 |
| +2.5 Volts monitor |  |
| +5 Volts monitor | 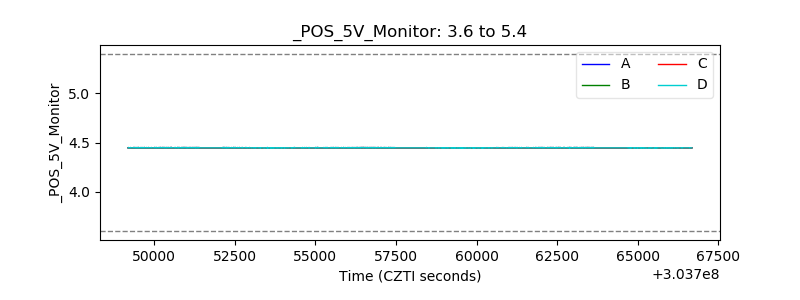 |
| _ROLL_ROT |  |
| _Roll_DEC |  |
| _Roll_RA |  |
| Veto Counter |  |