| Param | Original file | Final file |
|---|---|---|
| Filename | modeM0/AS1T03_133T01_9000003092cztM0_level2_bc.evt | modeM0/AS1T03_133T01_9000003092cztM0_level2_quad_clean.evt |
| Size (bytes) | 1,404,216,000 | 476,657,280 |
| Size | 1.3 GB | 454.6 MB |
| Events in quadrant A | 7,839,303 | 2,999,072 |
| Events in quadrant B | 9,122,518 | 3,008,035 |
| Events in quadrant C | 7,695,187 | 2,945,900 |
| Events in quadrant D | 15,175,859 | 2,774,232 |
| Mode M0 | |||
|---|---|---|---|
| Quadrant | BADHDUFLAG | Total packets | Discarded packets |
| A | 0 | 81462 | 0 |
| B | 0 | 86417 | 0 |
| C | 0 | 81013 | 0 |
| D | 0 | 104475 | 0 |
| Mode M9 | |||
|---|---|---|---|
| Quadrant | BADHDUFLAG | Total packets | Discarded packets |
| A | 0 | 49 | 0 |
| B | 0 | 49 | 0 |
| C | 0 | 49 | 0 |
| D | 0 | 49 | 0 |
| Mode SS | |||
|---|---|---|---|
| Quadrant | BADHDUFLAG | Total packets | Discarded packets |
| A | 0 | 800 | 0 |
| B | 0 | 800 | 0 |
| C | 0 | 800 | 0 |
| D | 0 | 800 | 0 |
| Quadrant | Total seconds | Saturated seconds | Saturation percentage |
|---|---|---|---|
| A | 39477 | 530 | 1.342554% |
| B | 39477 | 850 | 2.153152% |
| C | 39477 | 584 | 1.479342% |
| D | 39477 | 2045 | 5.180232% |
Noise dominated data is calculated using 1-second bins in cleaned event files. If a bin has >2000 counts, and if more than 50% of those come from <1% of pixels, then it is considered to be noise-dominated and hence unusable.
| Quadrant | # 1 sec bins | Bins with >0 counts | Bins with >2000 counts | High rate bins dominated by noise | Noise dominated (total time) | Noise dominated (detector-on time) | Marked lightcurve |
|---|---|---|---|---|---|---|---|
| A | 44197 | 39480 | 2 | 2 | 0.00% | 0.01% |  |
| B | 44197 | 39478 | 9 | 9 | 0.02% | 0.02% |  |
| C | 44197 | 39479 | 0 | 0 | 0.00% | 0.00% |  |
| D | 44197 | 39478 | 559 | 559 | 1.26% | 1.42% |  |
Top three noisy pixels from each quadrant. If the there are fewer than three noisy pixels in the level2.evt file, extra rows are filled as -1
| Pixel properties | Quadrant properties | ||||||
|---|---|---|---|---|---|---|---|
| Quadrant | DetID | PixID | Counts | Sigma | Mean | Median | Sigma |
| A | 15 | 174 | 82817 | 182.61 | 2019 | 1977 | 442.7 |
| A | 3 | 15 | 13373 | 25.74 | 2019 | 1977 | 442.7 |
| A | 0 | 226 | 13084 | 25.09 | 2019 | 1977 | 442.7 |
| B | 7 | 220 | 496231 | 1285.16 | 2031 | 1976 | 384.6 |
| B | 0 | 182 | 368238 | 952.35 | 2031 | 1976 | 384.6 |
| B | 3 | 64 | 123421 | 315.78 | 2031 | 1976 | 384.6 |
| C | 7 | 247 | 68863 | 141.92 | 1974 | 1960 | 471.4 |
| C | 10 | 91 | 15366 | 28.44 | 1974 | 1960 | 471.4 |
| C | 8 | 128 | 13671 | 24.84 | 1974 | 1960 | 471.4 |
| D | 1 | 52 | 6441600 | 13936.6 | 1967 | 1894 | 462.1 |
| D | 7 | 223 | 427099 | 920.21 | 1967 | 1894 | 462.1 |
| D | 9 | 1 | 261469 | 561.76 | 1967 | 1894 | 462.1 |
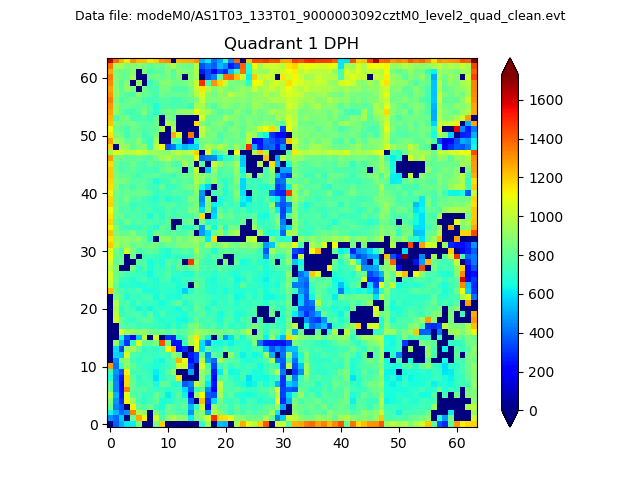
Histogram calculated using DETX and DETY for each event in the final _common_clean file
| Quadrant A |  |
 |
Quadrant B |
|---|---|---|---|
| Quadrant D | 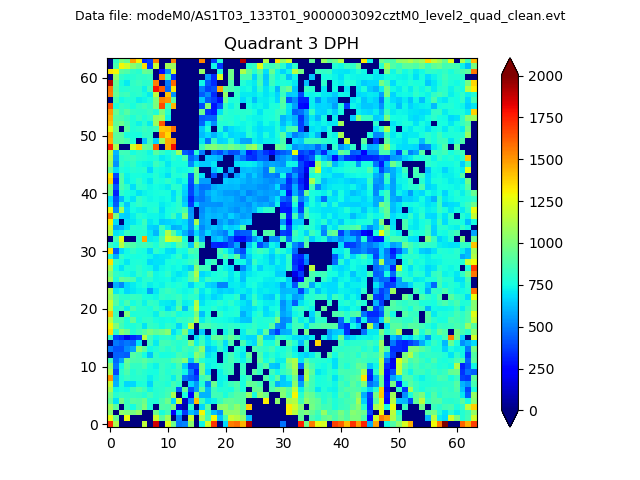 |
 |
Quadrant C |
| Plot type | Count rate plots | Images |
|---|---|---|
| Comparison with Poisson distribution Blue bars denote a histogram of data divided into 1 sec bins. Red curve is a Poisson curve with rate = median count rate of data. |
 |
 |
| Quadrant-wise count rates Data is divided into 100 sec bins |
 |
|
| Module-wise count rates for Quadrant A Data is divided into 100 sec bins |
 |
 |
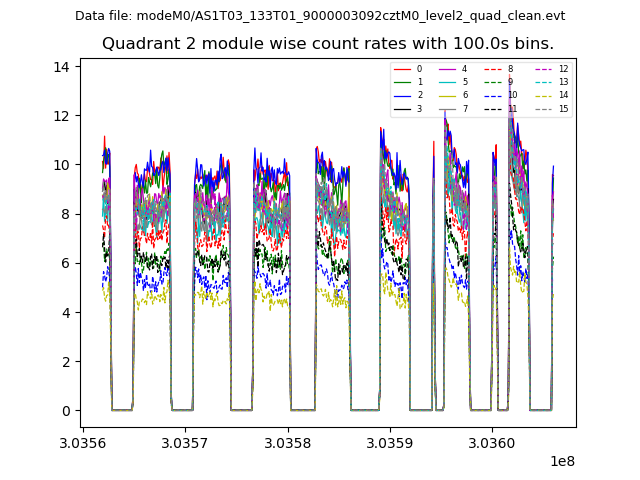
| Module-wise count rates for Quadrant B Data is divided into 100 sec bins |
 |
 |
| Module-wise count rates for Quadrant C Data is divided into 100 sec bins |
 |
 |
| Module-wise count rates for Quadrant D Data is divided into 100 sec bins |
 |
 |
| Parameter | Plot |
|---|---|
| CZT HV Monitor |  |
| D_VDD |  |
| Temperature 1 |  |
| Veto HV Monitor |  |
| Veto LLD |  |
| Alpha Counter |  |
| _CPM_Rate |  |
| CZT Counter |  |
| +2.5 Volts monitor |  |
| +5 Volts monitor |  |
| _ROLL_ROT | 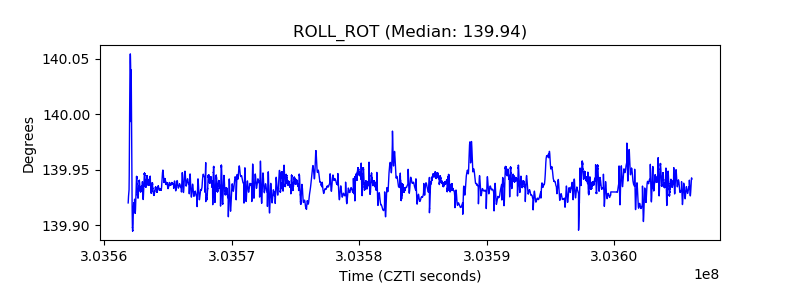 |
| _Roll_DEC | 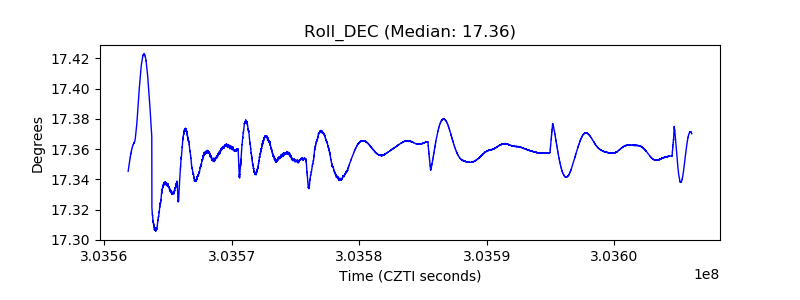 |
| _Roll_RA |  |
| Veto Counter |  |