| Param | Original file | Final file |
|---|---|---|
| Filename | modeM0/AS1A05_072T04_9000003094cztM0_level2_bc.evt | modeM0/AS1A05_072T04_9000003094cztM0_level2_quad_clean.evt |
| Size (bytes) | 3,351,631,680 | 1,238,250,240 |
| Size | 3.1 GB | 1.2 GB |
| Events in quadrant A | 19,827,278 | 8,006,079 |
| Events in quadrant B | 23,142,163 | 8,014,660 |
| Events in quadrant C | 19,960,264 | 7,636,740 |
| Events in quadrant D | 32,126,863 | 7,362,691 |
| Mode M9 | |||
|---|---|---|---|
| Quadrant | BADHDUFLAG | Total packets | Discarded packets |
| A | 0 | 176 | 0 |
| B | 0 | 176 | 0 |
| C | 0 | 176 | 0 |
| D | 0 | 176 | 0 |
| Mode SS | |||
|---|---|---|---|
| Quadrant | BADHDUFLAG | Total packets | Discarded packets |
| A | 0 | 1932 | 0 |
| B | 0 | 1932 | 0 |
| C | 0 | 1932 | 0 |
| D | 0 | 1932 | 0 |
| Mode M0 | |||
|---|---|---|---|
| Quadrant | BADHDUFLAG | Total packets | Discarded packets |
| A | 0 | 194912 | 0 |
| B | 0 | 208105 | 0 |
| C | 0 | 198653 | 0 |
| D | 0 | 233100 | 0 |
| Quadrant | Total seconds | Saturated seconds | Saturation percentage |
|---|---|---|---|
| A | 94626 | 984 | 1.039883% |
| B | 94625 | 1632 | 1.724703% |
| C | 94623 | 1599 | 1.689864% |
| D | 94625 | 4320 | 4.565390% |
Noise dominated data is calculated using 1-second bins in cleaned event files. If a bin has >2000 counts, and if more than 50% of those come from <1% of pixels, then it is considered to be noise-dominated and hence unusable.
| Quadrant | # 1 sec bins | Bins with >0 counts | Bins with >2000 counts | High rate bins dominated by noise | Noise dominated (total time) | Noise dominated (detector-on time) | Marked lightcurve |
|---|---|---|---|---|---|---|---|
| A | 112305 | 94635 | 0 | 0 | 0.00% | 0.00% | 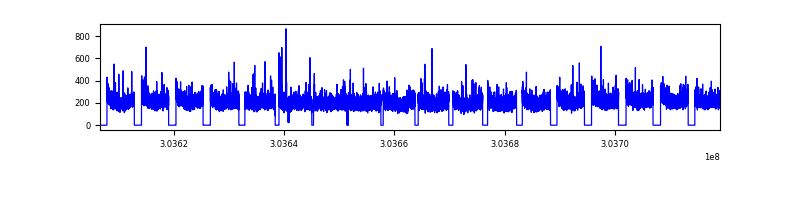 |
| B | 112305 | 94632 | 26 | 26 | 0.02% | 0.03% |  |
| C | 112305 | 94628 | 3 | 3 | 0.00% | 0.00% | 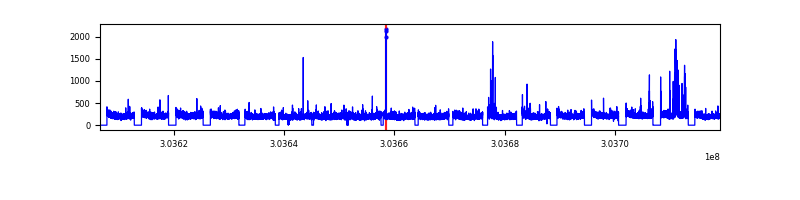 |
| D | 112305 | 94632 | 2112 | 2112 | 1.88% | 2.23% |  |
Top three noisy pixels from each quadrant. If the there are fewer than three noisy pixels in the level2.evt file, extra rows are filled as -1
| Pixel properties | Quadrant properties | ||||||
|---|---|---|---|---|---|---|---|
| Quadrant | DetID | PixID | Counts | Sigma | Mean | Median | Sigma |
| A | 0 | 226 | 33222 | 25.54 | 5161 | 5071 | 1102.0 |
| A | 12 | 194 | 32359 | 24.76 | 5161 | 5071 | 1102.0 |
| A | 12 | 96 | 29581 | 22.24 | 5161 | 5071 | 1102.0 |
| B | 7 | 220 | 978901 | 1010.51 | 5204 | 5090 | 963.7 |
| B | 0 | 189 | 504774 | 518.52 | 5204 | 5090 | 963.7 |
| B | 3 | 64 | 392447 | 401.96 | 5204 | 5090 | 963.7 |
| C | 9 | 54 | 605906 | 513.74 | 4960 | 4941 | 1169.8 |
| C | 7 | 247 | 133341 | 109.76 | 4960 | 4941 | 1169.8 |
| C | 10 | 91 | 70115 | 55.71 | 4960 | 4941 | 1169.8 |
| D | 1 | 52 | 3974263 | 3440.94 | 4979 | 4811 | 1153.6 |
| D | 7 | 223 | 3361917 | 2910.12 | 4979 | 4811 | 1153.6 |
| D | 1 | 239 | 1823647 | 1576.67 | 4979 | 4811 | 1153.6 |
Histogram calculated using DETX and DETY for each event in the final _common_clean file
| Quadrant A |  |
 |
Quadrant B |
|---|---|---|---|
| Quadrant D |  |
 |
Quadrant C |
| Plot type | Count rate plots | Images |
|---|---|---|
| Comparison with Poisson distribution Blue bars denote a histogram of data divided into 1 sec bins. Red curve is a Poisson curve with rate = median count rate of data. |
 |
 |
| Quadrant-wise count rates Data is divided into 100 sec bins |
 |
|
| Module-wise count rates for Quadrant A Data is divided into 100 sec bins |
 |
 |
| Module-wise count rates for Quadrant B Data is divided into 100 sec bins |
 |
 |
| Module-wise count rates for Quadrant C Data is divided into 100 sec bins |
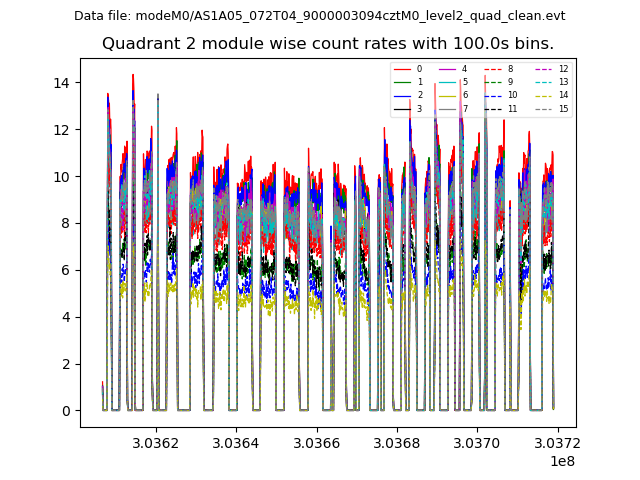 |
 |
| Module-wise count rates for Quadrant D Data is divided into 100 sec bins |
 |
 |
| Parameter | Plot |
|---|---|
| CZT HV Monitor |  |
| D_VDD |  |
| Temperature 1 |  |
| Veto HV Monitor |  |
| Veto LLD |  |
| Alpha Counter |  |
| _CPM_Rate |  |
| CZT Counter | 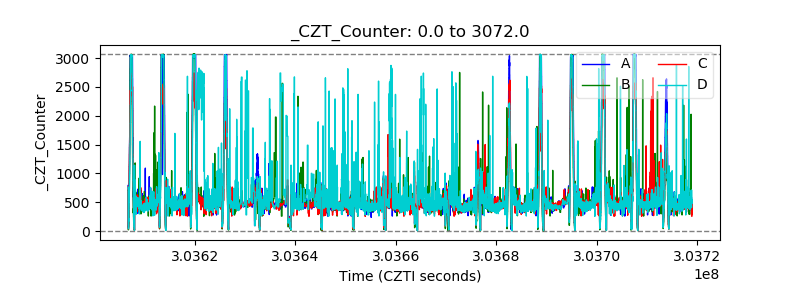 |
| +2.5 Volts monitor |  |
| +5 Volts monitor |  |
| _ROLL_ROT |  |
| _Roll_DEC |  |
| _Roll_RA |  |
| Veto Counter |  |