| Param | Original file | Final file |
|---|---|---|
| Filename | modeM0/AS1T03_131T01_9000003090cztM0_level2_bc.evt | modeM0/AS1T03_131T01_9000003090cztM0_level2_quad_clean.evt |
| Size (bytes) | 3,736,733,760 | 1,302,912,000 |
| Size | 3.5 GB | 1.2 GB |
| Events in quadrant A | 22,267,412 | 8,245,258 |
| Events in quadrant B | 24,817,983 | 8,362,696 |
| Events in quadrant C | 21,231,131 | 8,178,796 |
| Events in quadrant D | 37,915,793 | 7,699,644 |
| Mode SS | |||
|---|---|---|---|
| Quadrant | BADHDUFLAG | Total packets | Discarded packets |
| A | 0 | 2072 | 0 |
| B | 0 | 1970 | 0 |
| C | 0 | 2072 | 0 |
| D | 0 | 2072 | 0 |
| Mode M9 | |||
|---|---|---|---|
| Quadrant | BADHDUFLAG | Total packets | Discarded packets |
| A | 0 | 183 | 0 |
| B | 0 | 183 | 0 |
| C | 0 | 183 | 0 |
| D | 0 | 183 | 0 |
| Mode M0 | |||
|---|---|---|---|
| Quadrant | BADHDUFLAG | Total packets | Discarded packets |
| A | 0 | 213481 | 0 |
| B | 0 | 223952 | 0 |
| C | 0 | 211608 | 0 |
| D | 0 | 267828 | 0 |
| Quadrant | Total seconds | Saturated seconds | Saturation percentage |
|---|---|---|---|
| A | 101913 | 1296 | 1.271673% |
| B | 101913 | 1916 | 1.880035% |
| C | 101913 | 1624 | 1.593516% |
| D | 101913 | 4809 | 4.718731% |
Noise dominated data is calculated using 1-second bins in cleaned event files. If a bin has >2000 counts, and if more than 50% of those come from <1% of pixels, then it is considered to be noise-dominated and hence unusable.
| Quadrant | # 1 sec bins | Bins with >0 counts | Bins with >2000 counts | High rate bins dominated by noise | Noise dominated (total time) | Noise dominated (detector-on time) | Marked lightcurve |
|---|---|---|---|---|---|---|---|
| A | 119973 | 101916 | 36 | 36 | 0.03% | 0.04% |  |
| B | 119973 | 101919 | 16 | 16 | 0.01% | 0.02% |  |
| C | 119973 | 101914 | 0 | 0 | 0.00% | 0.00% |  |
| D | 119973 | 101912 | 956 | 956 | 0.80% | 0.94% |  |
Top three noisy pixels from each quadrant. If the there are fewer than three noisy pixels in the level2.evt file, extra rows are filled as -1
| Pixel properties | Quadrant properties | ||||||
|---|---|---|---|---|---|---|---|
| Quadrant | DetID | PixID | Counts | Sigma | Mean | Median | Sigma |
| A | 5 | 16 | 977593 | 812.11 | 5523 | 5424 | 1197.1 |
| A | 2 | 79 | 60822 | 46.28 | 5523 | 5424 | 1197.1 |
| A | 13 | 210 | 44290 | 32.47 | 5523 | 5424 | 1197.1 |
| B | 7 | 220 | 1450723 | 1371.49 | 5623 | 5487 | 1053.8 |
| B | 3 | 64 | 476142 | 446.64 | 5623 | 5487 | 1053.8 |
| B | 0 | 189 | 353316 | 330.08 | 5623 | 5487 | 1053.8 |
| C | 10 | 91 | 197491 | 151.62 | 5400 | 5390 | 1267.0 |
| C | 9 | 54 | 113013 | 84.94 | 5400 | 5390 | 1267.0 |
| C | 7 | 247 | 107841 | 80.86 | 5400 | 5390 | 1267.0 |
| D | 1 | 52 | 9802817 | 8008.0 | 5373 | 5191 | 1223.5 |
| D | 7 | 238 | 1522254 | 1239.96 | 5373 | 5191 | 1223.5 |
| D | 9 | 1 | 1461216 | 1190.07 | 5373 | 5191 | 1223.5 |
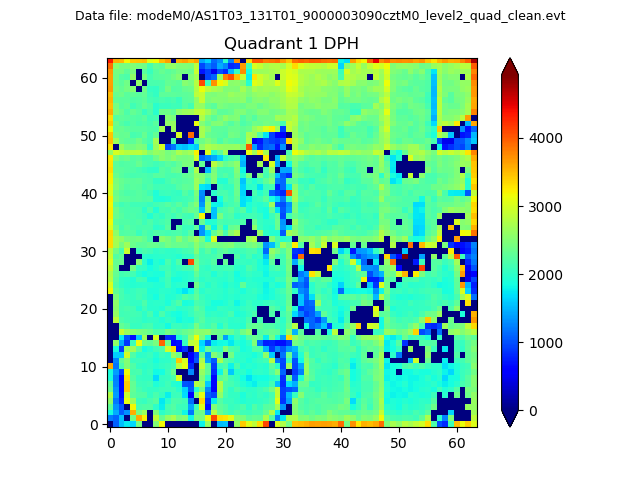
Histogram calculated using DETX and DETY for each event in the final _common_clean file
| Quadrant A |  |
 |
Quadrant B |
|---|---|---|---|
| Quadrant D |  |
 |
Quadrant C |
| Plot type | Count rate plots | Images |
|---|---|---|
| Comparison with Poisson distribution Blue bars denote a histogram of data divided into 1 sec bins. Red curve is a Poisson curve with rate = median count rate of data. |
 |
 |
| Quadrant-wise count rates Data is divided into 100 sec bins |
 |
|
| Module-wise count rates for Quadrant A Data is divided into 100 sec bins |
 |
 |
| Module-wise count rates for Quadrant B Data is divided into 100 sec bins |
 |
 |
| Module-wise count rates for Quadrant C Data is divided into 100 sec bins |
 |
 |
| Module-wise count rates for Quadrant D Data is divided into 100 sec bins |
 |
 |
| Parameter | Plot |
|---|---|
| CZT HV Monitor |  |
| D_VDD |  |
| Temperature 1 |  |
| Veto HV Monitor |  |
| Veto LLD | 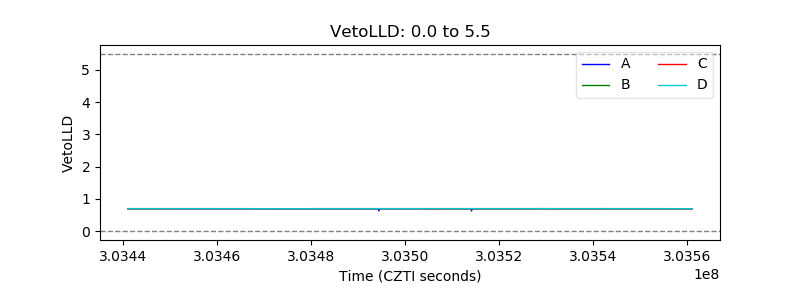 |
| Alpha Counter |  |
| _CPM_Rate |  |
| CZT Counter | 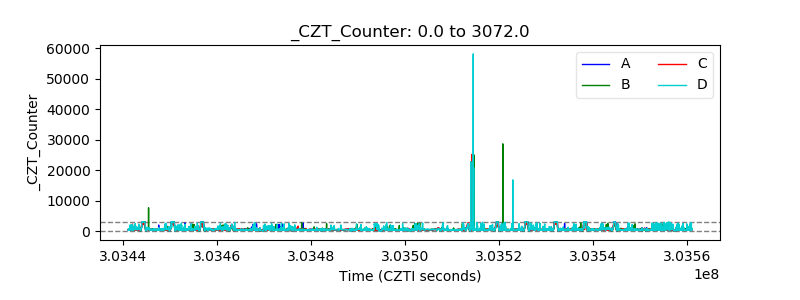 |
| +2.5 Volts monitor |  |
| +5 Volts monitor | 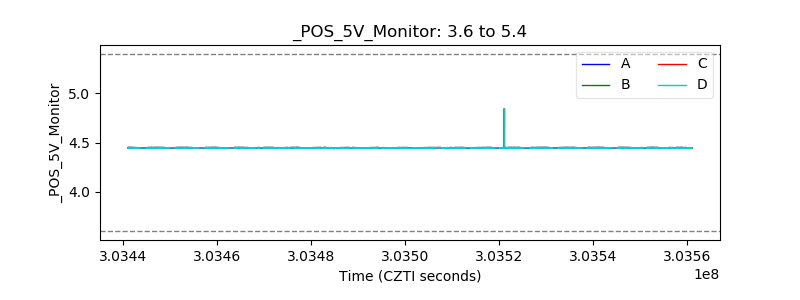 |
| _ROLL_ROT |  |
| _Roll_DEC |  |
| _Roll_RA |  |
| Veto Counter |  |