| Param | Original file | Final file |
|---|---|---|
| Filename | modeM0/AS1A05_227T03_9000003086cztM0_level2_bc.evt | modeM0/AS1A05_227T03_9000003086cztM0_level2_quad_clean.evt |
| Size (bytes) | 467,510,400 | 222,059,520 |
| Size | 445.9 MB | 211.8 MB |
| Events in quadrant A | 2,960,024 | 1,440,986 |
| Events in quadrant B | 3,429,669 | 1,443,480 |
| Events in quadrant C | 3,005,214 | 1,415,481 |
| Events in quadrant D | 3,734,557 | 1,391,264 |
| Mode SS | |||
|---|---|---|---|
| Quadrant | BADHDUFLAG | Total packets | Discarded packets |
| A | 0 | 306 | 0 |
| B | 0 | 306 | 0 |
| C | 0 | 306 | 0 |
| D | 0 | 306 | 0 |
| Mode M9 | |||
|---|---|---|---|
| Quadrant | BADHDUFLAG | Total packets | Discarded packets |
| A | 0 | 12 | 0 |
| B | 0 | 12 | 0 |
| C | 0 | 12 | 0 |
| D | 0 | 12 | 0 |
| Mode M0 | |||
|---|---|---|---|
| Quadrant | BADHDUFLAG | Total packets | Discarded packets |
| A | 0 | 30597 | 0 |
| B | 0 | 32029 | 0 |
| C | 0 | 30999 | 0 |
| D | 0 | 32574 | 0 |
| Quadrant | Total seconds | Saturated seconds | Saturation percentage |
|---|---|---|---|
| A | 14993 | 121 | 0.807043% |
| B | 14993 | 156 | 1.040486% |
| C | 14993 | 169 | 1.127193% |
| D | 14993 | 168 | 1.120523% |
Noise dominated data is calculated using 1-second bins in cleaned event files. If a bin has >2000 counts, and if more than 50% of those come from <1% of pixels, then it is considered to be noise-dominated and hence unusable.
| Quadrant | # 1 sec bins | Bins with >0 counts | Bins with >2000 counts | High rate bins dominated by noise | Noise dominated (total time) | Noise dominated (detector-on time) | Marked lightcurve |
|---|---|---|---|---|---|---|---|
| A | 16243 | 14992 | 0 | 0 | 0.00% | 0.00% |  |
| B | 16243 | 14992 | 5 | 5 | 0.03% | 0.03% | 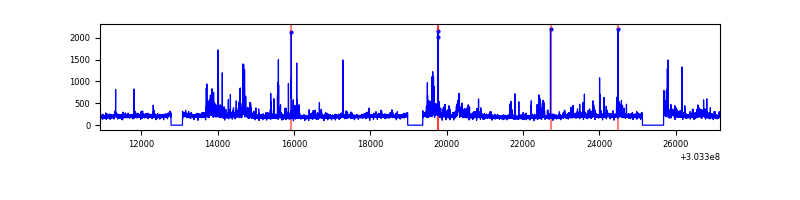 |
| C | 16243 | 14992 | 0 | 0 | 0.00% | 0.00% |  |
| D | 16243 | 14992 | 1 | 1 | 0.01% | 0.01% |  |
Top three noisy pixels from each quadrant. If the there are fewer than three noisy pixels in the level2.evt file, extra rows are filled as -1
| Pixel properties | Quadrant properties | ||||||
|---|---|---|---|---|---|---|---|
| Quadrant | DetID | PixID | Counts | Sigma | Mean | Median | Sigma |
| A | 5 | 16 | 28105 | 161.52 | 763 | 747 | 169.4 |
| A | 0 | 226 | 5015 | 25.2 | 763 | 747 | 169.4 |
| A | 12 | 194 | 4889 | 24.45 | 763 | 747 | 169.4 |
| B | 3 | 64 | 113554 | 765.95 | 764 | 745 | 147.3 |
| B | 0 | 229 | 97797 | 658.96 | 764 | 745 | 147.3 |
| B | 7 | 220 | 79802 | 536.78 | 764 | 745 | 147.3 |
| C | 7 | 247 | 71080 | 394.18 | 740 | 735 | 178.5 |
| C | 9 | 54 | 47924 | 264.42 | 740 | 735 | 178.5 |
| C | 10 | 91 | 35464 | 194.6 | 740 | 735 | 178.5 |
| D | 9 | 1 | 206470 | 1143.42 | 757 | 731 | 179.9 |
| D | 1 | 20 | 205950 | 1140.53 | 757 | 731 | 179.9 |
| D | 1 | 52 | 197416 | 1093.1 | 757 | 731 | 179.9 |
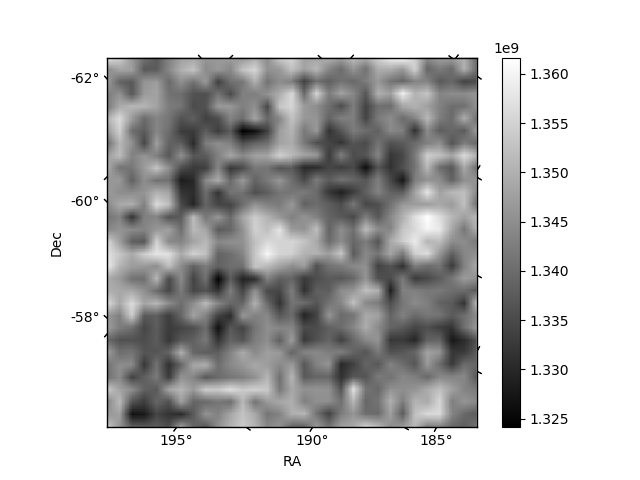
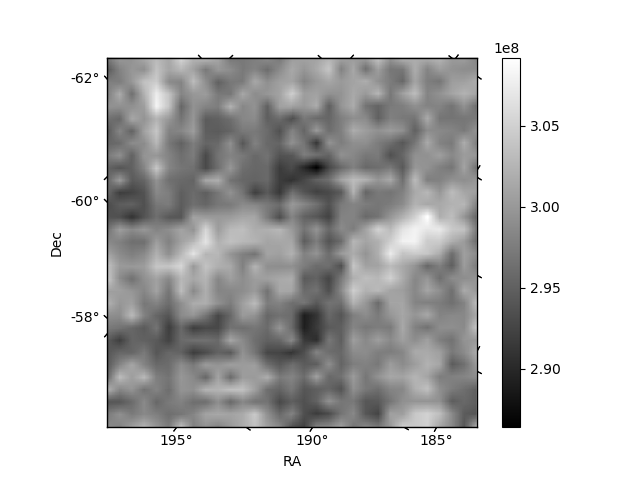
Histogram calculated using DETX and DETY for each event in the final _common_clean file
| Quadrant A |  |
 |
Quadrant B |
|---|---|---|---|
| Quadrant D |  |
 |
Quadrant C |
| Plot type | Count rate plots | Images |
|---|---|---|
| Comparison with Poisson distribution Blue bars denote a histogram of data divided into 1 sec bins. Red curve is a Poisson curve with rate = median count rate of data. |
 |
 |
| Quadrant-wise count rates Data is divided into 100 sec bins |
 |
|
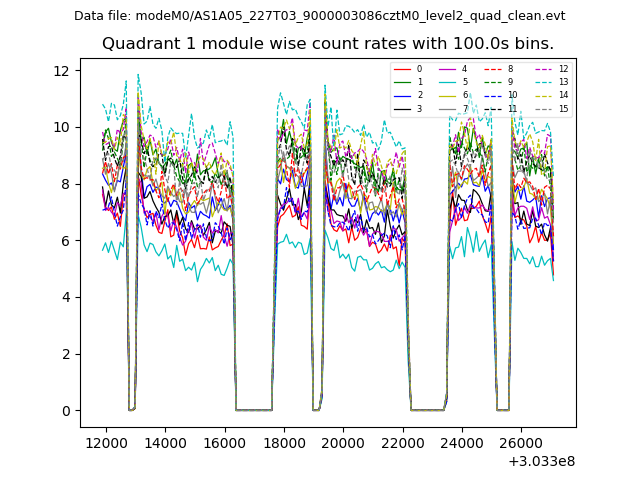
| Module-wise count rates for Quadrant A Data is divided into 100 sec bins |
 |
 |
| Module-wise count rates for Quadrant B Data is divided into 100 sec bins |
 |
 |
| Module-wise count rates for Quadrant C Data is divided into 100 sec bins |
 |
 |
| Module-wise count rates for Quadrant D Data is divided into 100 sec bins |
 |
 |
| Parameter | Plot |
|---|---|
| CZT HV Monitor |  |
| D_VDD | 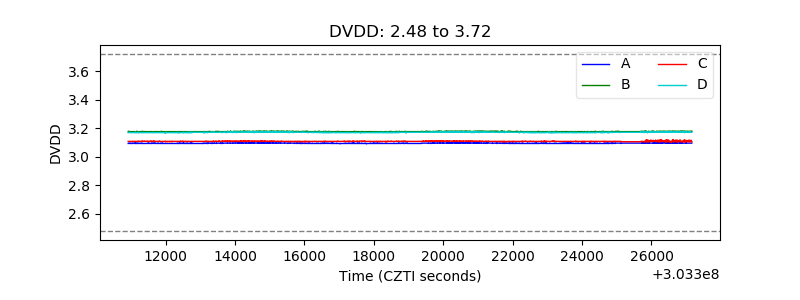 |
| Temperature 1 |  |
| Veto HV Monitor |  |
| Veto LLD |  |
| Alpha Counter |  |
| _CPM_Rate |  |
| CZT Counter |  |
| +2.5 Volts monitor |  |
| +5 Volts monitor |  |
| _ROLL_ROT |  |
| _Roll_DEC |  |
| _Roll_RA |  |
| Veto Counter |  |