| Param | Original file | Final file |
|---|---|---|
| Filename | modeM0/AS1A05_088T05_9000003088cztM0_level2_bc.evt | modeM0/AS1A05_088T05_9000003088cztM0_level2_quad_clean.evt |
| Size (bytes) | 3,574,912,320 | 1,218,358,080 |
| Size | 3.3 GB | 1.1 GB |
| Events in quadrant A | 20,246,687 | 7,842,307 |
| Events in quadrant B | 23,582,889 | 7,871,452 |
| Events in quadrant C | 19,658,478 | 7,508,325 |
| Events in quadrant D | 38,290,531 | 7,151,167 |
| Mode M9 | |||
|---|---|---|---|
| Quadrant | BADHDUFLAG | Total packets | Discarded packets |
| A | 0 | 167 | 0 |
| B | 0 | 167 | 0 |
| C | 0 | 167 | 0 |
| D | 0 | 167 | 0 |
| Mode M0 | |||
|---|---|---|---|
| Quadrant | BADHDUFLAG | Total packets | Discarded packets |
| A | 0 | 198184 | 0 |
| B | 0 | 212536 | 0 |
| C | 0 | 198651 | 0 |
| D | 0 | 261646 | 0 |
| Mode SS | |||
|---|---|---|---|
| Quadrant | BADHDUFLAG | Total packets | Discarded packets |
| A | 0 | 1942 | 0 |
| B | 0 | 1834 | 0 |
| C | 0 | 1942 | 0 |
| D | 0 | 1942 | 0 |
| Quadrant | Total seconds | Saturated seconds | Saturation percentage |
|---|---|---|---|
| A | 95358 | 903 | 0.946958% |
| B | 95362 | 1634 | 1.713471% |
| C | 95354 | 1214 | 1.273151% |
| D | 95345 | 5064 | 5.311238% |
Noise dominated data is calculated using 1-second bins in cleaned event files. If a bin has >2000 counts, and if more than 50% of those come from <1% of pixels, then it is considered to be noise-dominated and hence unusable.
| Quadrant | # 1 sec bins | Bins with >0 counts | Bins with >2000 counts | High rate bins dominated by noise | Noise dominated (total time) | Noise dominated (detector-on time) | Marked lightcurve |
|---|---|---|---|---|---|---|---|
| A | 111916 | 95396 | 10 | 10 | 0.01% | 0.01% |  |
| B | 111916 | 95389 | 12 | 12 | 0.01% | 0.01% |  |
| C | 111916 | 95389 | 3 | 3 | 0.00% | 0.00% | 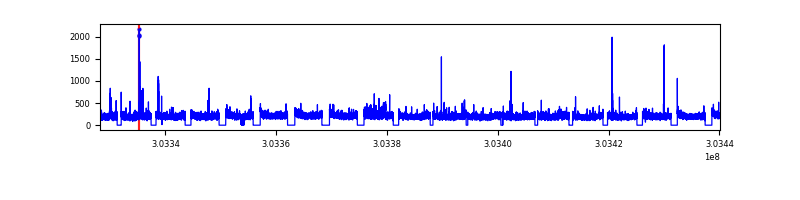 |
| D | 111916 | 95392 | 784 | 784 | 0.70% | 0.82% |  |
Top three noisy pixels from each quadrant. If the there are fewer than three noisy pixels in the level2.evt file, extra rows are filled as -1
| Pixel properties | Quadrant properties | ||||||
|---|---|---|---|---|---|---|---|
| Quadrant | DetID | PixID | Counts | Sigma | Mean | Median | Sigma |
| A | 5 | 16 | 197650 | 173.48 | 5195 | 5113 | 1109.9 |
| A | 12 | 96 | 66030 | 54.89 | 5195 | 5113 | 1109.9 |
| A | 15 | 174 | 41430 | 32.72 | 5195 | 5113 | 1109.9 |
| B | 7 | 220 | 1355907 | 1385.95 | 5223 | 5104 | 974.6 |
| B | 3 | 64 | 538448 | 547.22 | 5223 | 5104 | 974.6 |
| B | 0 | 229 | 426580 | 432.44 | 5223 | 5104 | 974.6 |
| C | 9 | 54 | 220795 | 186.42 | 4960 | 4953 | 1157.8 |
| C | 7 | 247 | 188822 | 158.81 | 4960 | 4953 | 1157.8 |
| C | 3 | 233 | 84614 | 68.8 | 4960 | 4953 | 1157.8 |
| D | 1 | 52 | 6096531 | 5330.75 | 4978 | 4807 | 1142.8 |
| D | 9 | 1 | 2969633 | 2594.46 | 4978 | 4807 | 1142.8 |
| D | 5 | 222 | 2449009 | 2138.87 | 4978 | 4807 | 1142.8 |
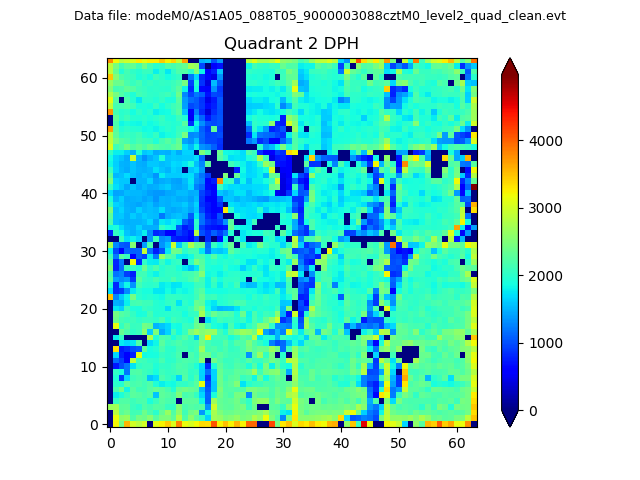
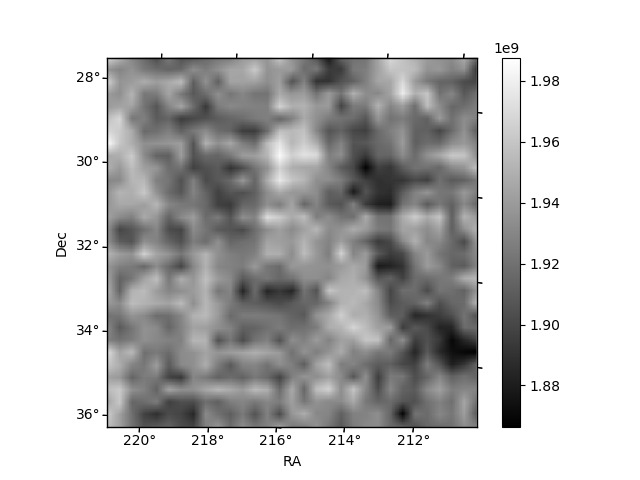
Histogram calculated using DETX and DETY for each event in the final _common_clean file
| Quadrant A |  |
 |
Quadrant B |
|---|---|---|---|
| Quadrant D |  |
 |
Quadrant C |
| Plot type | Count rate plots | Images |
|---|---|---|
| Comparison with Poisson distribution Blue bars denote a histogram of data divided into 1 sec bins. Red curve is a Poisson curve with rate = median count rate of data. |
 |
 |
| Quadrant-wise count rates Data is divided into 100 sec bins |
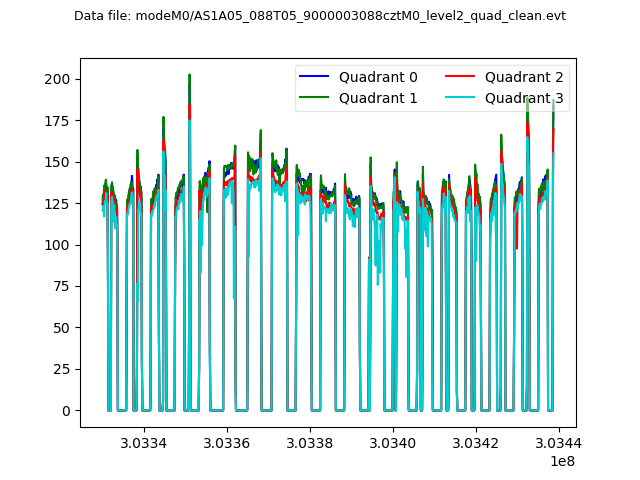 |
|
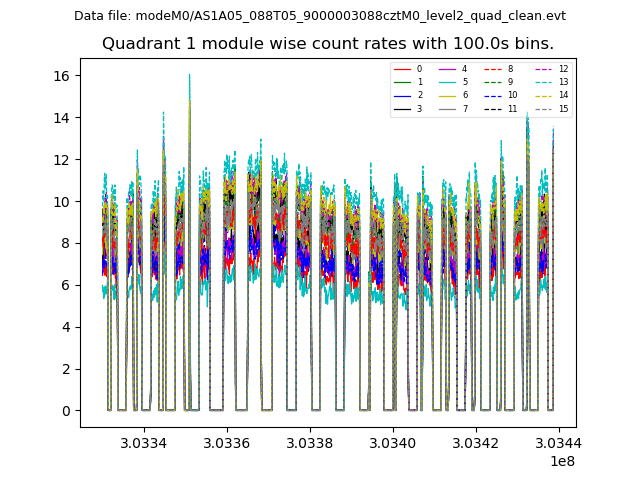
| Module-wise count rates for Quadrant A Data is divided into 100 sec bins |
 |
 |
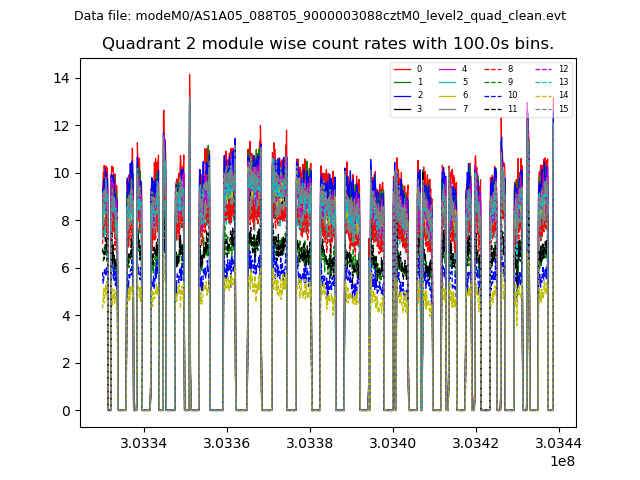
| Module-wise count rates for Quadrant B Data is divided into 100 sec bins |
 |
 |
| Module-wise count rates for Quadrant C Data is divided into 100 sec bins |
 |
 |
| Module-wise count rates for Quadrant D Data is divided into 100 sec bins |
 |
 |
| Parameter | Plot |
|---|---|
| CZT HV Monitor | 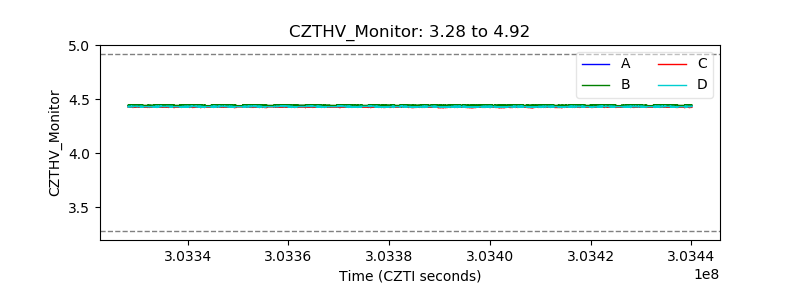 |
| D_VDD |  |
| Temperature 1 | 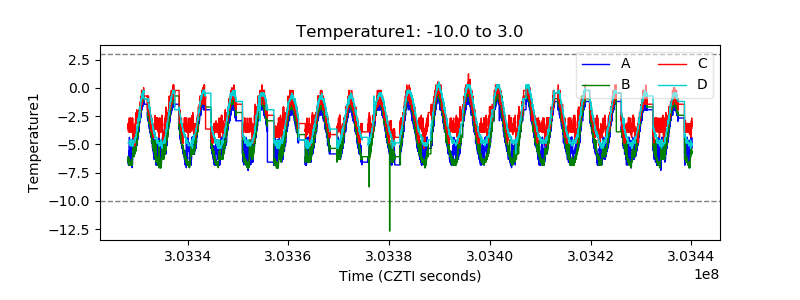 |
| Veto HV Monitor |  |
| Veto LLD |  |
| Alpha Counter |  |
| _CPM_Rate |  |
| CZT Counter |  |
| +2.5 Volts monitor | 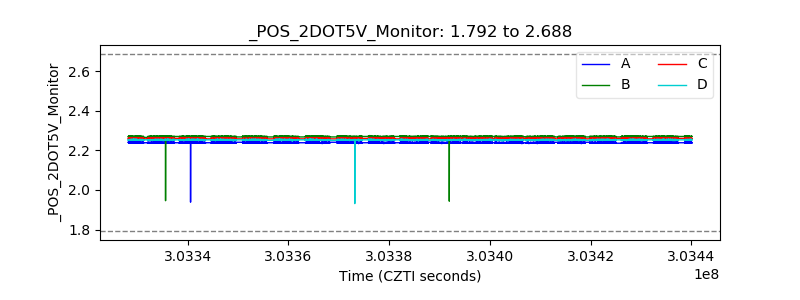 |
| +5 Volts monitor | 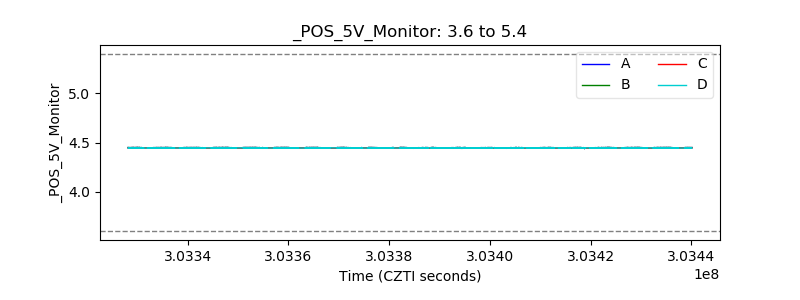 |
| _ROLL_ROT |  |
| _Roll_DEC |  |
| _Roll_RA | 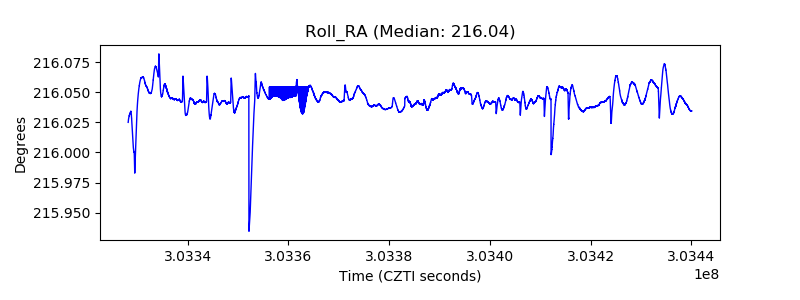 |
| Veto Counter | 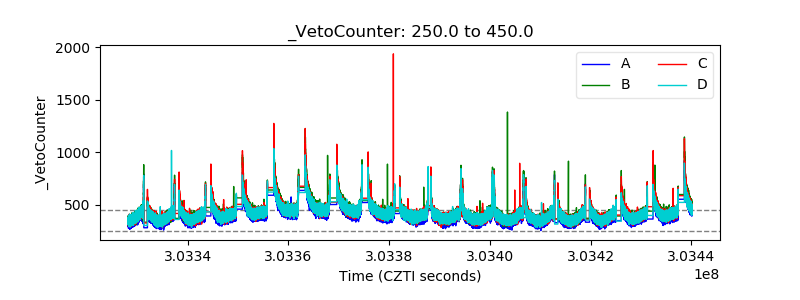 |