| Param | Original file | Final file |
|---|---|---|
| Filename | modeM0/AS1A05_025T17_9000003084cztM0_level2_bc.evt | modeM0/AS1A05_025T17_9000003084cztM0_level2_quad_clean.evt |
| Size (bytes) | 1,246,752,000 | 636,880,320 |
| Size | 1.2 GB | 607.4 MB |
| Events in quadrant A | 7,611,091 | 4,252,793 |
| Events in quadrant B | 9,050,082 | 4,288,136 |
| Events in quadrant C | 7,692,526 | 4,255,816 |
| Events in quadrant D | 11,027,735 | 4,104,501 |
| Mode SS | |||
|---|---|---|---|
| Quadrant | BADHDUFLAG | Total packets | Discarded packets |
| A | 0 | 706 | 0 |
| B | 0 | 706 | 0 |
| C | 0 | 706 | 0 |
| D | 0 | 706 | 0 |
| Mode M0 | |||
|---|---|---|---|
| Quadrant | BADHDUFLAG | Total packets | Discarded packets |
| A | 0 | 71838 | 0 |
| B | 0 | 77386 | 0 |
| C | 0 | 73023 | 0 |
| D | 0 | 82426 | 0 |
| Mode M9 | |||
|---|---|---|---|
| Quadrant | BADHDUFLAG | Total packets | Discarded packets |
| A | 0 | 71 | 0 |
| B | 0 | 71 | 0 |
| C | 0 | 71 | 0 |
| D | 0 | 71 | 0 |
| Quadrant | Total seconds | Saturated seconds | Saturation percentage |
|---|---|---|---|
| A | 34820 | 432 | 1.240666% |
| B | 34820 | 673 | 1.932797% |
| C | 34820 | 678 | 1.947157% |
| D | 34820 | 853 | 2.449742% |
Noise dominated data is calculated using 1-second bins in cleaned event files. If a bin has >2000 counts, and if more than 50% of those come from <1% of pixels, then it is considered to be noise-dominated and hence unusable.
| Quadrant | # 1 sec bins | Bins with >0 counts | Bins with >2000 counts | High rate bins dominated by noise | Noise dominated (total time) | Noise dominated (detector-on time) | Marked lightcurve |
|---|---|---|---|---|---|---|---|
| A | 41139 | 34820 | 0 | 0 | 0.00% | 0.00% |  |
| B | 41139 | 34821 | 9 | 9 | 0.02% | 0.03% | 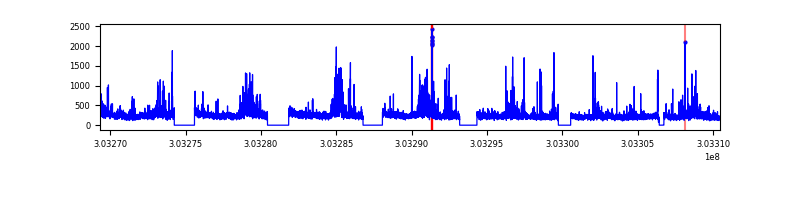 |
| C | 41139 | 34819 | 0 | 0 | 0.00% | 0.00% | 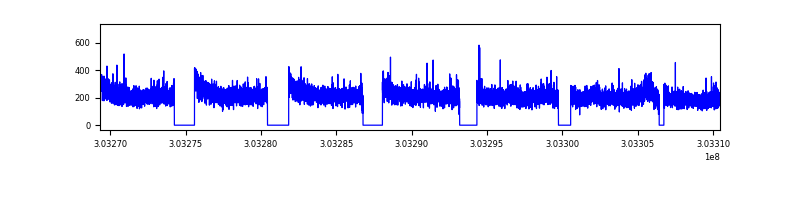 |
| D | 41139 | 34819 | 23 | 23 | 0.06% | 0.07% |  |
Top three noisy pixels from each quadrant. If the there are fewer than three noisy pixels in the level2.evt file, extra rows are filled as -1
| Pixel properties | Quadrant properties | ||||||
|---|---|---|---|---|---|---|---|
| Quadrant | DetID | PixID | Counts | Sigma | Mean | Median | Sigma |
| A | 15 | 174 | 30227 | 66.8 | 1977 | 1954 | 423.2 |
| A | 0 | 226 | 13093 | 26.32 | 1977 | 1954 | 423.2 |
| A | 12 | 194 | 12718 | 25.43 | 1977 | 1954 | 423.2 |
| B | 7 | 220 | 452076 | 1230.04 | 1994 | 1955 | 365.9 |
| B | 0 | 229 | 304894 | 827.84 | 1994 | 1955 | 365.9 |
| B | 0 | 190 | 159255 | 429.85 | 1994 | 1955 | 365.9 |
| C | 10 | 91 | 167418 | 362.03 | 1949 | 1951 | 457.1 |
| C | 7 | 247 | 31517 | 64.69 | 1949 | 1951 | 457.1 |
| C | 13 | 61 | 11383 | 20.64 | 1949 | 1951 | 457.1 |
| D | 1 | 52 | 1363353 | 2989.32 | 1973 | 1914 | 455.4 |
| D | 1 | 20 | 741360 | 1623.61 | 1973 | 1914 | 455.4 |
| D | 9 | 1 | 670973 | 1469.06 | 1973 | 1914 | 455.4 |
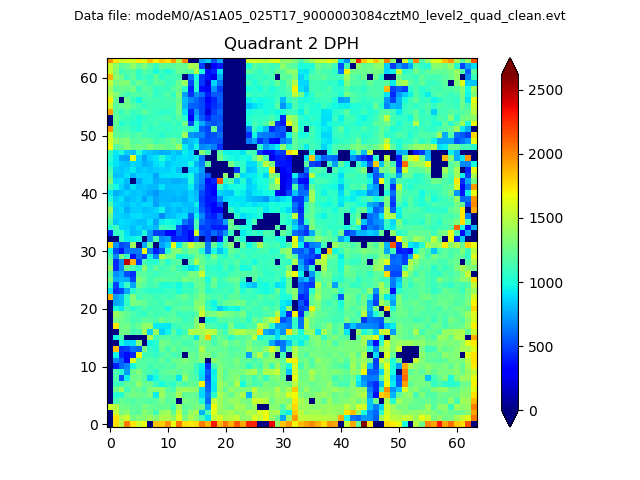
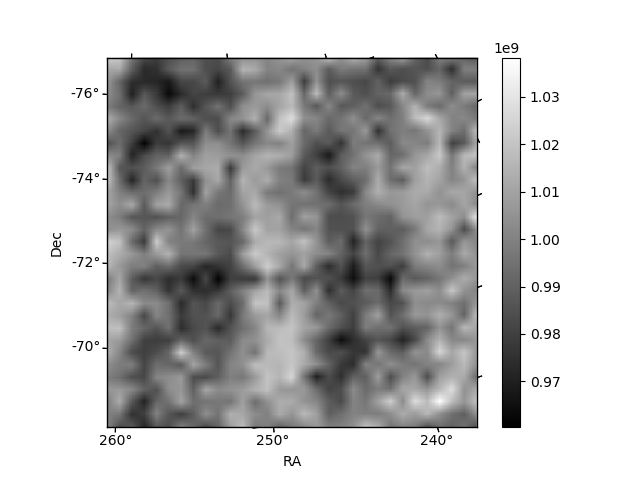
Histogram calculated using DETX and DETY for each event in the final _common_clean file
| Quadrant A |  |
 |
Quadrant B |
|---|---|---|---|
| Quadrant D |  |
 |
Quadrant C |
| Plot type | Count rate plots | Images |
|---|---|---|
| Comparison with Poisson distribution Blue bars denote a histogram of data divided into 1 sec bins. Red curve is a Poisson curve with rate = median count rate of data. |
 |
 |
| Quadrant-wise count rates Data is divided into 100 sec bins |
 |
|
| Module-wise count rates for Quadrant A Data is divided into 100 sec bins |
 |
 |
| Module-wise count rates for Quadrant B Data is divided into 100 sec bins |
 |
 |
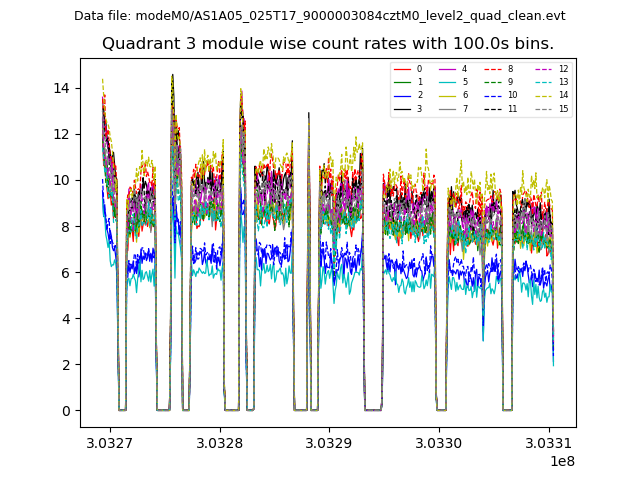
| Module-wise count rates for Quadrant C Data is divided into 100 sec bins |
 |
 |
| Module-wise count rates for Quadrant D Data is divided into 100 sec bins |
 |
 |
| Parameter | Plot |
|---|---|
| CZT HV Monitor |  |
| D_VDD | 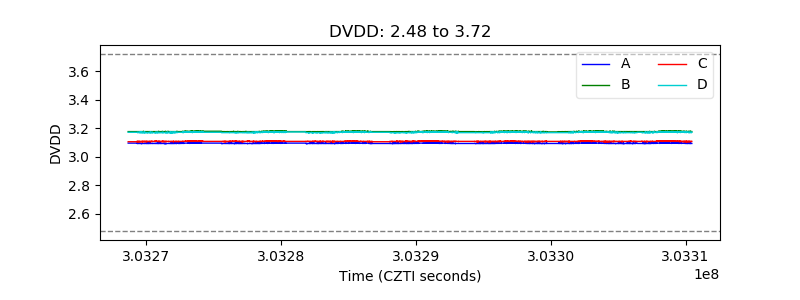 |
| Temperature 1 |  |
| Veto HV Monitor |  |
| Veto LLD | 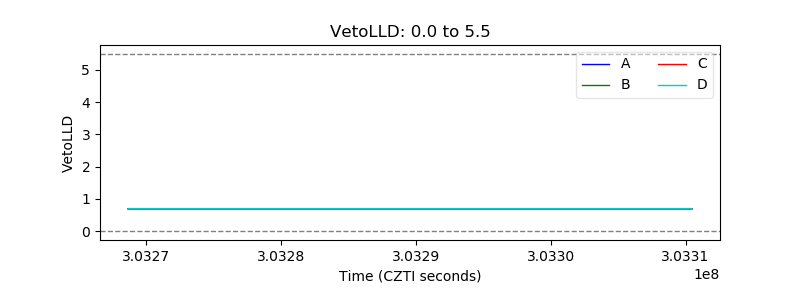 |
| Alpha Counter |  |
| _CPM_Rate |  |
| CZT Counter |  |
| +2.5 Volts monitor | 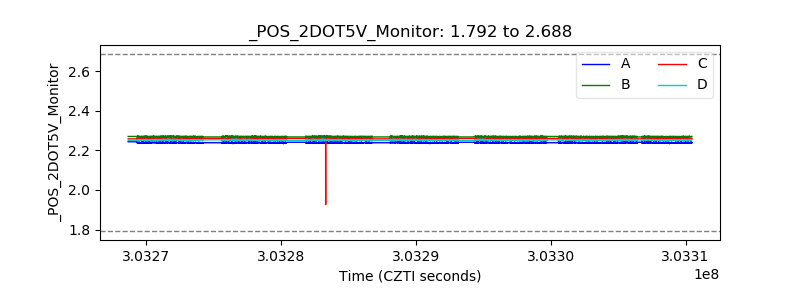 |
| +5 Volts monitor |  |
| _ROLL_ROT |  |
| _Roll_DEC |  |
| _Roll_RA |  |
| Veto Counter | 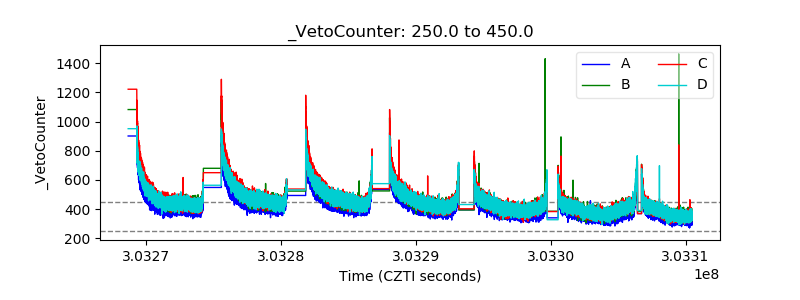 |