| Param | Original file | Final file |
|---|---|---|
| Filename | modeM0/AS1C04_001T01_9000003082cztM0_level2_bc.evt | modeM0/AS1C04_001T01_9000003082cztM0_level2_quad_clean.evt |
| Size (bytes) | 2,393,081,280 | 1,336,939,200 |
| Size | 2.2 GB | 1.2 GB |
| Events in quadrant A | 18,339,609 | 9,128,112 |
| Events in quadrant B | 17,510,550 | 9,124,636 |
| Events in quadrant C | 13,770,928 | 8,772,867 |
| Events in quadrant D | 18,121,340 | 8,713,752 |
| Mode SS | |||
|---|---|---|---|
| Quadrant | BADHDUFLAG | Total packets | Discarded packets |
| A | 0 | 1414 | 0 |
| B | 0 | 1414 | 0 |
| C | 0 | 1416 | 0 |
| D | 0 | 1416 | 0 |
| Mode M9 | |||
|---|---|---|---|
| Quadrant | BADHDUFLAG | Total packets | Discarded packets |
| A | 0 | 105 | 0 |
| B | 0 | 105 | 0 |
| C | 0 | 106 | 0 |
| D | 0 | 106 | 0 |
| Mode M0 | |||
|---|---|---|---|
| Quadrant | BADHDUFLAG | Total packets | Discarded packets |
| A | 0 | 155148 | 0 |
| B | 0 | 154407 | 0 |
| C | 0 | 142872 | 0 |
| D | 0 | 153776 | 0 |
| Quadrant | Total seconds | Saturated seconds | Saturation percentage |
|---|---|---|---|
| A | 69408 | 1073 | 1.545931% |
| B | 69419 | 1327 | 1.911580% |
| C | 69423 | 1024 | 1.475015% |
| D | 69426 | 1157 | 1.666523% |
Noise dominated data is calculated using 1-second bins in cleaned event files. If a bin has >2000 counts, and if more than 50% of those come from <1% of pixels, then it is considered to be noise-dominated and hence unusable.
| Quadrant | # 1 sec bins | Bins with >0 counts | Bins with >2000 counts | High rate bins dominated by noise | Noise dominated (total time) | Noise dominated (detector-on time) | Marked lightcurve |
|---|---|---|---|---|---|---|---|
| A | 79494 | 69489 | 54 | 54 | 0.07% | 0.08% |  |
| B | 79494 | 69488 | 77 | 77 | 0.10% | 0.11% |  |
| C | 79495 | 69496 | 1 | 1 | 0.00% | 0.00% |  |
| D | 79494 | 69488 | 90 | 90 | 0.11% | 0.13% |  |
Top three noisy pixels from each quadrant. If the there are fewer than three noisy pixels in the level2.evt file, extra rows are filled as -1
| Pixel properties | Quadrant properties | ||||||
|---|---|---|---|---|---|---|---|
| Quadrant | DetID | PixID | Counts | Sigma | Mean | Median | Sigma |
| A | 6 | 16 | 3317160 | 4151.67 | 3676 | 3623 | 798.1 |
| A | 5 | 16 | 696855 | 868.58 | 3676 | 3623 | 798.1 |
| A | 15 | 174 | 197102 | 242.42 | 3676 | 3623 | 798.1 |
| B | 7 | 220 | 971161 | 1406.62 | 3659 | 3579 | 687.9 |
| B | 3 | 64 | 853313 | 1235.3 | 3659 | 3579 | 687.9 |
| B | 0 | 219 | 350881 | 504.89 | 3659 | 3579 | 687.9 |
| C | 7 | 247 | 99476 | 116.19 | 3495 | 3482 | 826.2 |
| C | 9 | 54 | 89216 | 103.77 | 3495 | 3482 | 826.2 |
| C | 10 | 91 | 46656 | 52.26 | 3495 | 3482 | 826.2 |
| D | 1 | 52 | 1490953 | 1758.62 | 3621 | 3505 | 845.8 |
| D | 1 | 20 | 1257801 | 1482.96 | 3621 | 3505 | 845.8 |
| D | 9 | 1 | 390166 | 457.15 | 3621 | 3505 | 845.8 |
Histogram calculated using DETX and DETY for each event in the final _common_clean file
| Quadrant A | 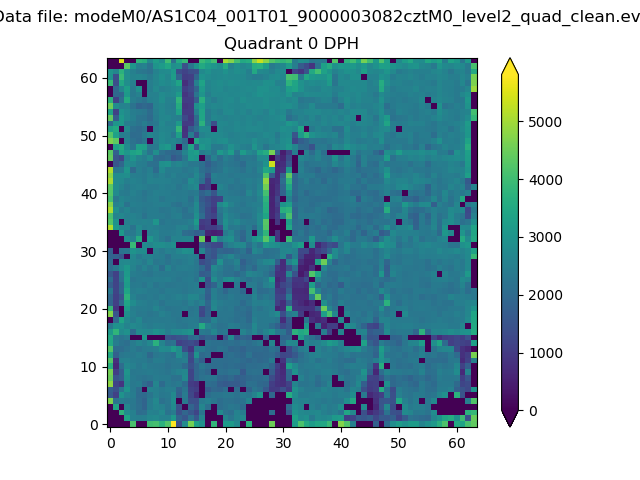 |
 |
Quadrant B |
|---|---|---|---|
| Quadrant D |  |
 |
Quadrant C |
| Plot type | Count rate plots | Images |
|---|---|---|
| Comparison with Poisson distribution Blue bars denote a histogram of data divided into 1 sec bins. Red curve is a Poisson curve with rate = median count rate of data. |
 |
 |
| Quadrant-wise count rates Data is divided into 100 sec bins |
 |
|
| Module-wise count rates for Quadrant A Data is divided into 100 sec bins |
 |
 |
| Module-wise count rates for Quadrant B Data is divided into 100 sec bins |
 |
 |
| Module-wise count rates for Quadrant C Data is divided into 100 sec bins |
 |
 |
| Module-wise count rates for Quadrant D Data is divided into 100 sec bins |
 |
 |
| Parameter | Plot |
|---|---|
| CZT HV Monitor | 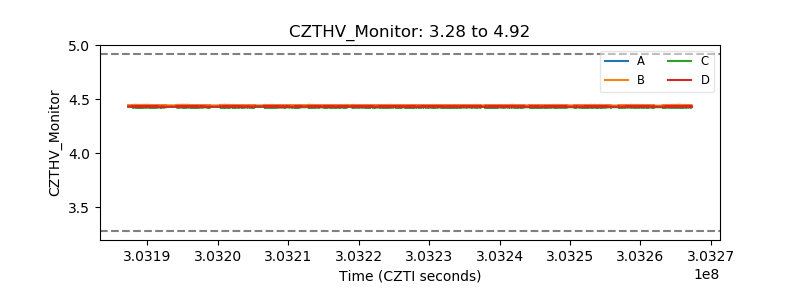 |
| D_VDD |  |
| Temperature 1 |  |
| Veto HV Monitor |  |
| Veto LLD | 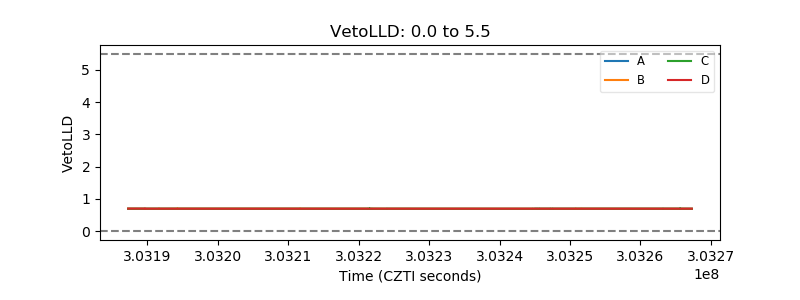 |
| Alpha Counter |  |
| _CPM_Rate |  |
| CZT Counter |  |
| +2.5 Volts monitor | 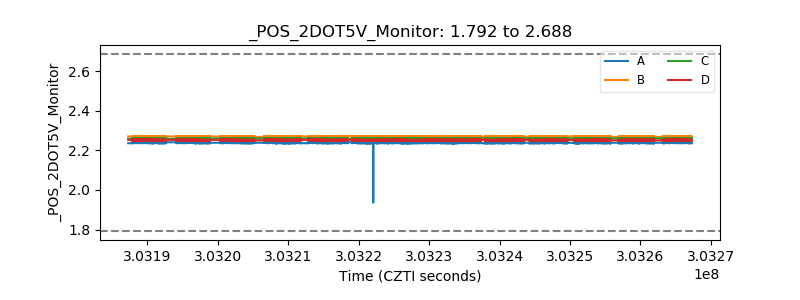 |
| +5 Volts monitor |  |
| _ROLL_ROT |  |
| _Roll_DEC |  |
| _Roll_RA |  |
| Veto Counter |  |