| Param | Original file | Final file |
|---|---|---|
| Filename | modeM0/AS1A06_002T03_9000003080cztM0_level2_bc.evt | modeM0/AS1A06_002T03_9000003080cztM0_level2_quad_clean.evt |
| Size (bytes) | 6,295,904,640 | 1,953,636,480 |
| Size | 5.9 GB | 1.8 GB |
| Events in quadrant A | 32,504,755 | 12,572,214 |
| Events in quadrant B | 36,979,161 | 12,622,499 |
| Events in quadrant C | 31,391,998 | 12,351,809 |
| Events in quadrant D | 79,864,567 | 11,622,556 |
| Mode M9 | |||
|---|---|---|---|
| Quadrant | BADHDUFLAG | Total packets | Discarded packets |
| A | 0 | 230 | 0 |
| B | 0 | 231 | 0 |
| C | 0 | 232 | 0 |
| D | 0 | 232 | 0 |
| Mode M0 | |||
|---|---|---|---|
| Quadrant | BADHDUFLAG | Total packets | Discarded packets |
| A | 0 | 307316 | 0 |
| B | 0 | 326244 | 0 |
| C | 0 | 309229 | 0 |
| D | 0 | 455040 | 0 |
| Mode SS | |||
|---|---|---|---|
| Quadrant | BADHDUFLAG | Total packets | Discarded packets |
| A | 0 | 2972 | 0 |
| B | 0 | 2970 | 0 |
| C | 0 | 2972 | 0 |
| D | 0 | 2972 | 0 |
| Quadrant | Total seconds | Saturated seconds | Saturation percentage |
|---|---|---|---|
| A | 146031 | 1828 | 1.251789% |
| B | 146029 | 2695 | 1.845524% |
| C | 146031 | 2890 | 1.979032% |
| D | 146029 | 12664 | 8.672250% |
Noise dominated data is calculated using 1-second bins in cleaned event files. If a bin has >2000 counts, and if more than 50% of those come from <1% of pixels, then it is considered to be noise-dominated and hence unusable.
| Quadrant | # 1 sec bins | Bins with >0 counts | Bins with >2000 counts | High rate bins dominated by noise | Noise dominated (total time) | Noise dominated (detector-on time) | Marked lightcurve |
|---|---|---|---|---|---|---|---|
| A | 196388 | 146046 | 28 | 28 | 0.01% | 0.02% | 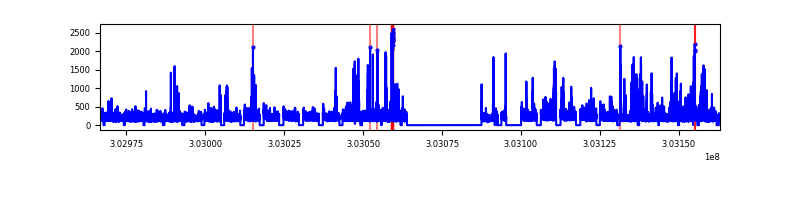 |
| B | 196388 | 146039 | 18 | 18 | 0.01% | 0.01% |  |
| C | 196387 | 146034 | 9 | 9 | 0.00% | 0.01% | 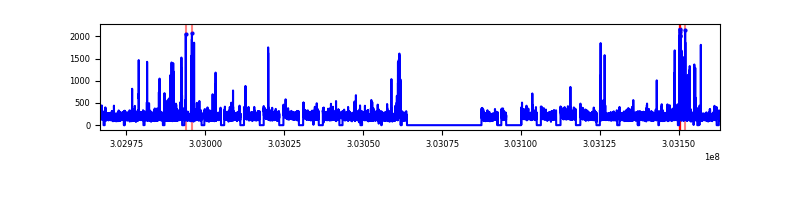 |
| D | 196388 | 146039 | 5531 | 5531 | 2.82% | 3.79% |  |
Top three noisy pixels from each quadrant. If the there are fewer than three noisy pixels in the level2.evt file, extra rows are filled as -1
| Pixel properties | Quadrant properties | ||||||
|---|---|---|---|---|---|---|---|
| Quadrant | DetID | PixID | Counts | Sigma | Mean | Median | Sigma |
| A | 6 | 16 | 835717 | 476.74 | 8016 | 7895 | 1736.4 |
| A | 5 | 16 | 658953 | 374.95 | 8016 | 7895 | 1736.4 |
| A | 15 | 174 | 179414 | 98.78 | 8016 | 7895 | 1736.4 |
| B | 7 | 220 | 2079164 | 1377.2 | 8066 | 7880 | 1504.0 |
| B | 0 | 189 | 956577 | 630.79 | 8066 | 7880 | 1504.0 |
| B | 3 | 64 | 601339 | 394.59 | 8066 | 7880 | 1504.0 |
| C | 9 | 54 | 1245640 | 679.38 | 7770 | 7756 | 1822.1 |
| C | 10 | 91 | 173568 | 91.0 | 7770 | 7756 | 1822.1 |
| C | 13 | 61 | 45097 | 20.49 | 7770 | 7756 | 1822.1 |
| D | 1 | 52 | 21070788 | 11663.79 | 7758 | 7504 | 1805.9 |
| D | 1 | 239 | 16112624 | 8918.21 | 7758 | 7504 | 1805.9 |
| D | 1 | 20 | 4770203 | 2637.34 | 7758 | 7504 | 1805.9 |
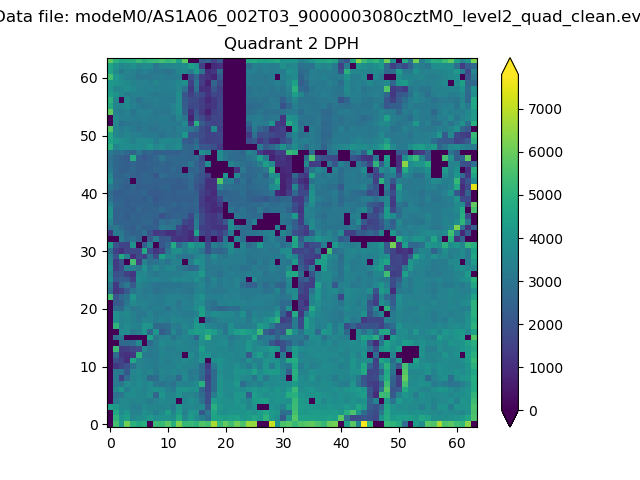
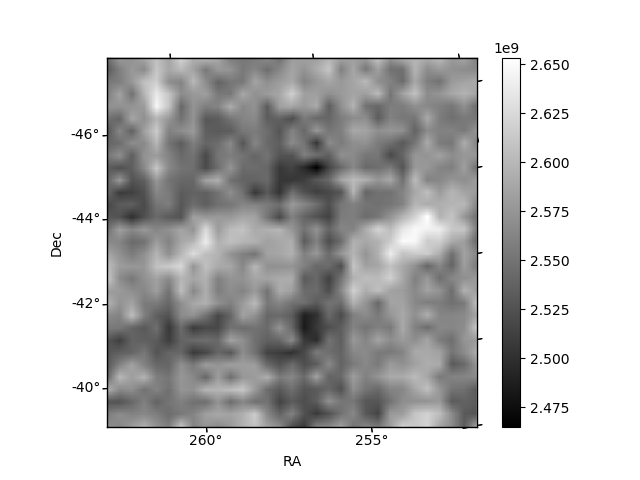
Histogram calculated using DETX and DETY for each event in the final _common_clean file
| Quadrant A |  |
 |
Quadrant B |
|---|---|---|---|
| Quadrant D |  |
 |
Quadrant C |
| Plot type | Count rate plots | Images |
|---|---|---|
| Comparison with Poisson distribution Blue bars denote a histogram of data divided into 1 sec bins. Red curve is a Poisson curve with rate = median count rate of data. |
 |
 |
| Quadrant-wise count rates Data is divided into 100 sec bins |
 |
|
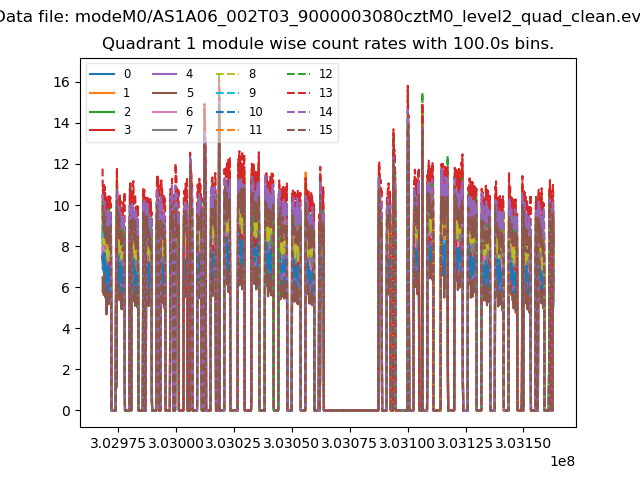
| Module-wise count rates for Quadrant A Data is divided into 100 sec bins |
 |
 |
| Module-wise count rates for Quadrant B Data is divided into 100 sec bins |
 |
 |
| Module-wise count rates for Quadrant C Data is divided into 100 sec bins |
 |
 |
| Module-wise count rates for Quadrant D Data is divided into 100 sec bins |
 |
 |
| Parameter | Plot |
|---|---|
| CZT HV Monitor |  |
| D_VDD |  |
| Temperature 1 |  |
| Veto HV Monitor | 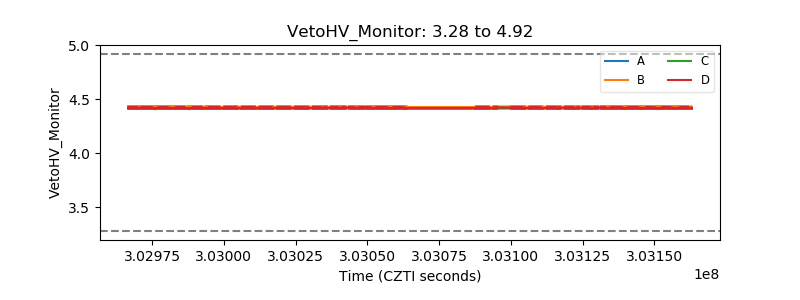 |
| Veto LLD |  |
| Alpha Counter | 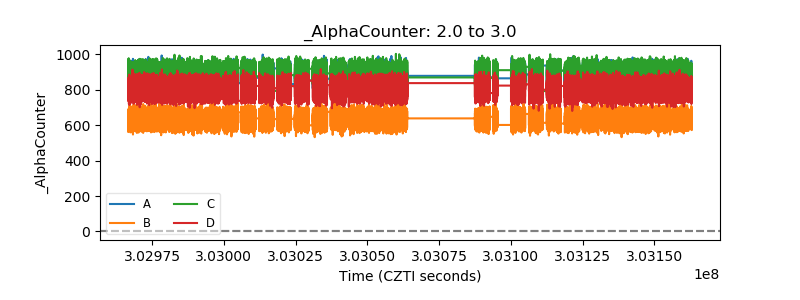 |
| _CPM_Rate | 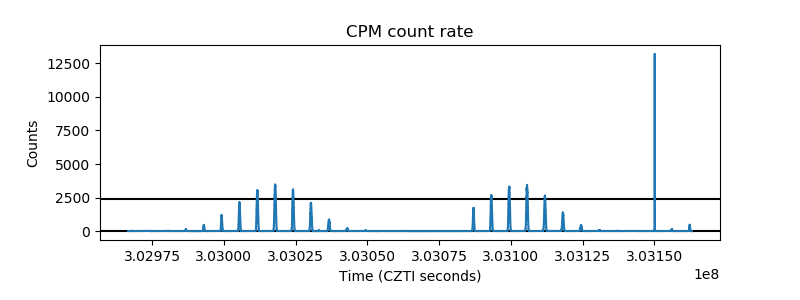 |
| CZT Counter |  |
| +2.5 Volts monitor | 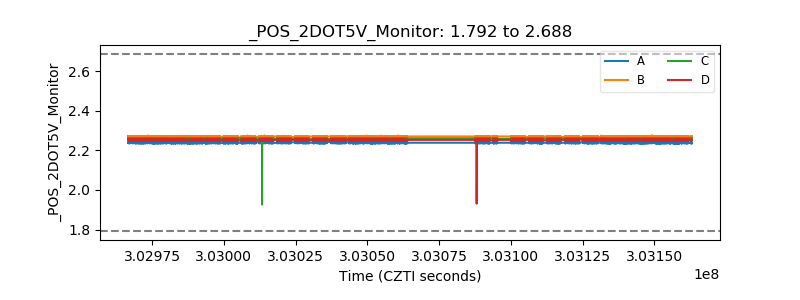 |
| +5 Volts monitor |  |
| _ROLL_ROT |  |
| _Roll_DEC |  |
| _Roll_RA |  |
| Veto Counter | 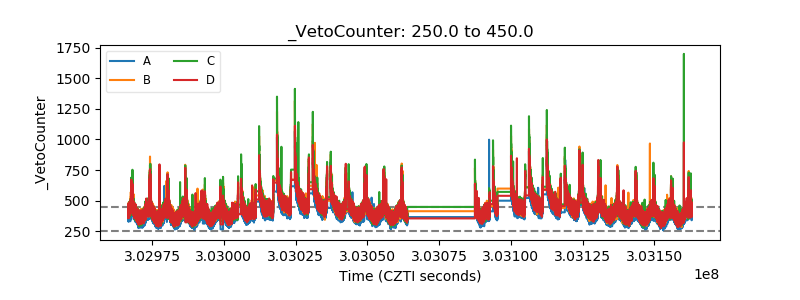 |