| Param | Original file | Final file |
|---|---|---|
| Filename | modeM0/AS1A05_160T01_9000003078cztM0_level2_bc.evt | modeM0/AS1A05_160T01_9000003078cztM0_level2_quad_clean.evt |
| Size (bytes) | 5,573,589,120 | 1,292,077,440 |
| Size | 5.2 GB | 1.2 GB |
| Events in quadrant A | 22,526,477 | 8,431,710 |
| Events in quadrant B | 23,964,210 | 8,602,710 |
| Events in quadrant C | 21,925,093 | 7,940,090 |
| Events in quadrant D | 93,372,049 | 7,085,034 |
| Mode M9 | |||
|---|---|---|---|
| Quadrant | BADHDUFLAG | Total packets | Discarded packets |
| A | 0 | 186 | 0 |
| B | 0 | 187 | 0 |
| C | 0 | 187 | 0 |
| D | 0 | 187 | 0 |
| Mode M0 | |||
|---|---|---|---|
| Quadrant | BADHDUFLAG | Total packets | Discarded packets |
| A | 0 | 215466 | 0 |
| B | 0 | 219716 | 0 |
| C | 0 | 216815 | 0 |
| D | 0 | 441452 | 0 |
| Mode SS | |||
|---|---|---|---|
| Quadrant | BADHDUFLAG | Total packets | Discarded packets |
| A | 0 | 2102 | 0 |
| B | 0 | 2108 | 0 |
| C | 0 | 2110 | 0 |
| D | 0 | 1998 | 0 |
| Quadrant | Total seconds | Saturated seconds | Saturation percentage |
|---|---|---|---|
| A | 103306 | 1233 | 1.193542% |
| B | 103299 | 1617 | 1.565359% |
| C | 103306 | 1920 | 1.858556% |
| D | 103144 | 18246 | 17.689832% |
Noise dominated data is calculated using 1-second bins in cleaned event files. If a bin has >2000 counts, and if more than 50% of those come from <1% of pixels, then it is considered to be noise-dominated and hence unusable.
| Quadrant | # 1 sec bins | Bins with >0 counts | Bins with >2000 counts | High rate bins dominated by noise | Noise dominated (total time) | Noise dominated (detector-on time) | Marked lightcurve |
|---|---|---|---|---|---|---|---|
| A | 122146 | 103458 | 0 | 0 | 0.00% | 0.00% |  |
| B | 122145 | 103452 | 24 | 24 | 0.02% | 0.02% | 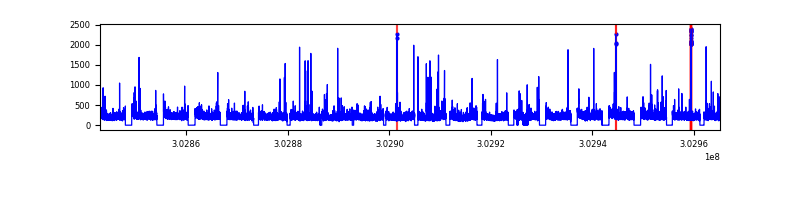 |
| C | 122145 | 103477 | 4 | 4 | 0.00% | 0.00% | 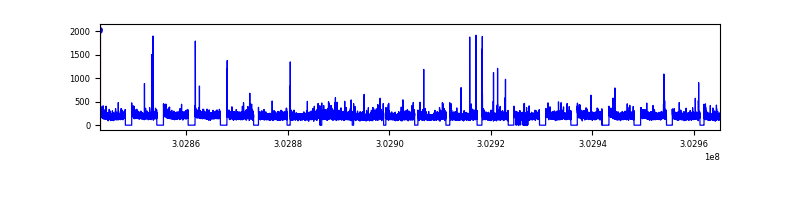 |
| D | 122145 | 103289 | 10132 | 10132 | 8.30% | 9.81% |  |
Top three noisy pixels from each quadrant. If the there are fewer than three noisy pixels in the level2.evt file, extra rows are filled as -1
| Pixel properties | Quadrant properties | ||||||
|---|---|---|---|---|---|---|---|
| Quadrant | DetID | PixID | Counts | Sigma | Mean | Median | Sigma |
| A | 5 | 203 | 57068 | 40.99 | 5855 | 5753 | 1251.8 |
| A | 0 | 226 | 37278 | 25.18 | 5855 | 5753 | 1251.8 |
| A | 12 | 194 | 36681 | 24.71 | 5855 | 5753 | 1251.8 |
| B | 0 | 189 | 413727 | 370.94 | 5910 | 5771 | 1099.8 |
| B | 0 | 229 | 254242 | 225.93 | 5910 | 5771 | 1099.8 |
| B | 0 | 219 | 194791 | 171.87 | 5910 | 5771 | 1099.8 |
| C | 3 | 233 | 304072 | 235.76 | 5490 | 5473 | 1266.5 |
| C | 9 | 54 | 220692 | 169.93 | 5490 | 5473 | 1266.5 |
| C | 0 | 10 | 217247 | 167.21 | 5490 | 5473 | 1266.5 |
| D | 1 | 52 | 35130482 | 29473.38 | 5265 | 5107 | 1191.8 |
| D | 1 | 239 | 23738485 | 19914.46 | 5265 | 5107 | 1191.8 |
| D | 1 | 20 | 9283286 | 7785.24 | 5265 | 5107 | 1191.8 |
Histogram calculated using DETX and DETY for each event in the final _common_clean file
| Quadrant A |  |
 |
Quadrant B |
|---|---|---|---|
| Quadrant D |  |
 |
Quadrant C |
| Plot type | Count rate plots | Images |
|---|---|---|
| Comparison with Poisson distribution Blue bars denote a histogram of data divided into 1 sec bins. Red curve is a Poisson curve with rate = median count rate of data. |
 |
 |
| Quadrant-wise count rates Data is divided into 100 sec bins |
 |
|
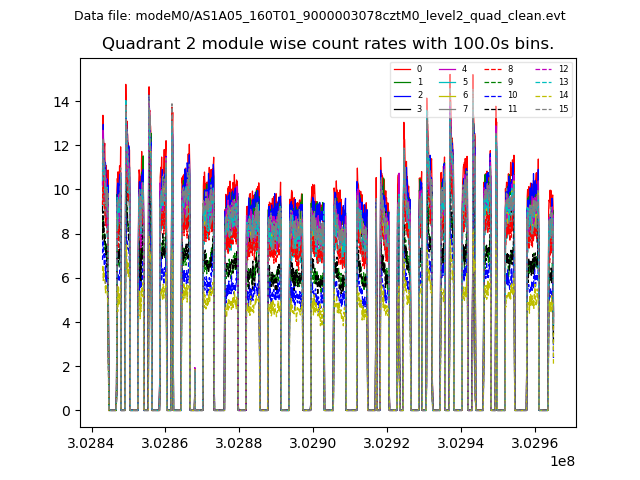
| Module-wise count rates for Quadrant A Data is divided into 100 sec bins |
 |
 |
| Module-wise count rates for Quadrant B Data is divided into 100 sec bins |
 |
 |
| Module-wise count rates for Quadrant C Data is divided into 100 sec bins |
 |
 |
| Module-wise count rates for Quadrant D Data is divided into 100 sec bins |
 |
 |
| Parameter | Plot |
|---|---|
| CZT HV Monitor | 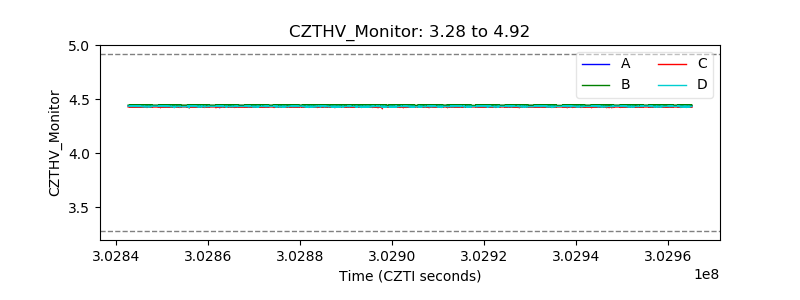 |
| D_VDD |  |
| Temperature 1 |  |
| Veto HV Monitor | 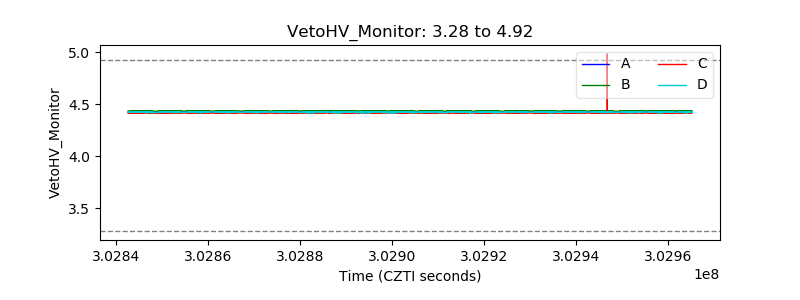 |
| Veto LLD |  |
| Alpha Counter | 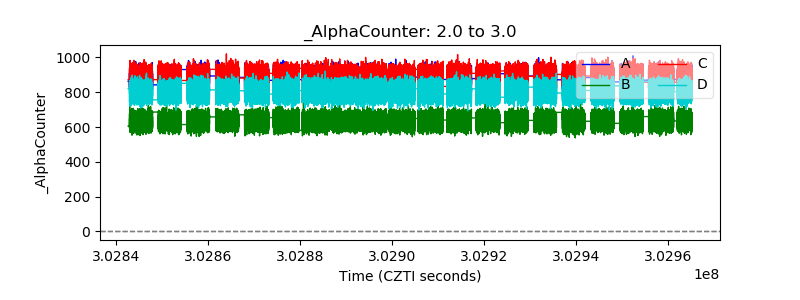 |
| _CPM_Rate | 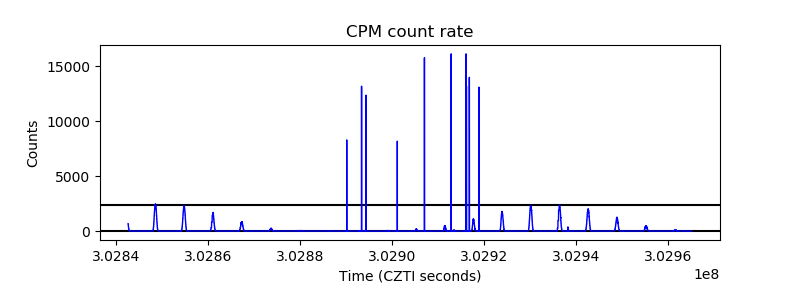 |
| CZT Counter |  |
| +2.5 Volts monitor |  |
| +5 Volts monitor |  |
| _ROLL_ROT |  |
| _Roll_DEC |  |
| _Roll_RA |  |
| Veto Counter |  |