| Param | Original file | Final file |
|---|---|---|
| Filename | modeM0/AS1C04_001T01_9000003074cztM0_level2_bc.evt | modeM0/AS1C04_001T01_9000003074cztM0_level2_quad_clean.evt |
| Size (bytes) | 2,985,477,120 | 1,087,220,160 |
| Size | 2.8 GB | 1.0 GB |
| Events in quadrant A | 14,317,507 | 7,494,180 |
| Events in quadrant B | 17,171,722 | 7,361,197 |
| Events in quadrant C | 13,128,063 | 7,061,877 |
| Events in quadrant D | 41,463,979 | 6,646,634 |
| Mode M0 | |||
|---|---|---|---|
| Quadrant | BADHDUFLAG | Total packets | Discarded packets |
| A | 0 | 133604 | 0 |
| B | 0 | 146755 | 0 |
| C | 0 | 132132 | 0 |
| D | 0 | 230334 | 0 |
| Mode M9 | |||
|---|---|---|---|
| Quadrant | BADHDUFLAG | Total packets | Discarded packets |
| A | 0 | 99 | 0 |
| B | 0 | 99 | 0 |
| C | 0 | 99 | 0 |
| D | 0 | 99 | 0 |
| Mode SS | |||
|---|---|---|---|
| Quadrant | BADHDUFLAG | Total packets | Discarded packets |
| A | 0 | 1292 | 0 |
| B | 0 | 1290 | 0 |
| C | 0 | 1292 | 0 |
| D | 0 | 1292 | 0 |
| Quadrant | Total seconds | Saturated seconds | Saturation percentage |
|---|---|---|---|
| A | 63686 | 672 | 1.055177% |
| B | 63684 | 1382 | 2.170090% |
| C | 63685 | 997 | 1.565518% |
| D | 63685 | 9005 | 14.139907% |
Noise dominated data is calculated using 1-second bins in cleaned event files. If a bin has >2000 counts, and if more than 50% of those come from <1% of pixels, then it is considered to be noise-dominated and hence unusable.
| Quadrant | # 1 sec bins | Bins with >0 counts | Bins with >2000 counts | High rate bins dominated by noise | Noise dominated (total time) | Noise dominated (detector-on time) | Marked lightcurve |
|---|---|---|---|---|---|---|---|
| A | 73449 | 63689 | 0 | 0 | 0.00% | 0.00% |  |
| B | 73449 | 63687 | 93 | 93 | 0.13% | 0.15% |  |
| C | 73449 | 63686 | 1 | 1 | 0.00% | 0.00% |  |
| D | 73449 | 63690 | 2903 | 2903 | 3.95% | 4.56% | 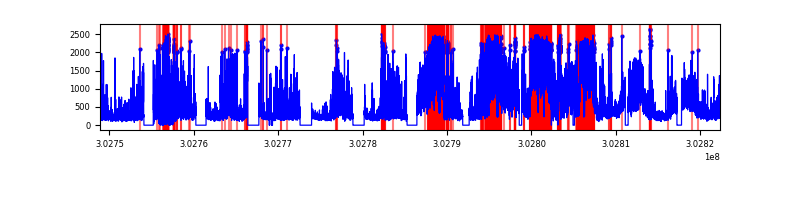 |
Top three noisy pixels from each quadrant. If the there are fewer than three noisy pixels in the level2.evt file, extra rows are filled as -1
| Pixel properties | Quadrant properties | ||||||
|---|---|---|---|---|---|---|---|
| Quadrant | DetID | PixID | Counts | Sigma | Mean | Median | Sigma |
| A | 2 | 79 | 492434 | 647.31 | 3498 | 3452 | 755.4 |
| A | 5 | 16 | 244148 | 318.63 | 3498 | 3452 | 755.4 |
| A | 8 | 205 | 55923 | 69.46 | 3498 | 3452 | 755.4 |
| B | 7 | 220 | 1163367 | 1797.82 | 3438 | 3362 | 645.2 |
| B | 0 | 189 | 1084723 | 1675.93 | 3438 | 3362 | 645.2 |
| B | 3 | 64 | 415219 | 638.31 | 3438 | 3362 | 645.2 |
| C | 9 | 54 | 208611 | 264.23 | 3283 | 3275 | 777.1 |
| C | 3 | 233 | 133131 | 167.1 | 3283 | 3275 | 777.1 |
| C | 7 | 247 | 68238 | 83.6 | 3283 | 3275 | 777.1 |
| D | 1 | 20 | 20600057 | 27104.96 | 3247 | 3138 | 759.9 |
| D | 1 | 52 | 3946879 | 5189.85 | 3247 | 3138 | 759.9 |
| D | 1 | 239 | 1563084 | 2052.84 | 3247 | 3138 | 759.9 |
Histogram calculated using DETX and DETY for each event in the final _common_clean file
| Quadrant A | 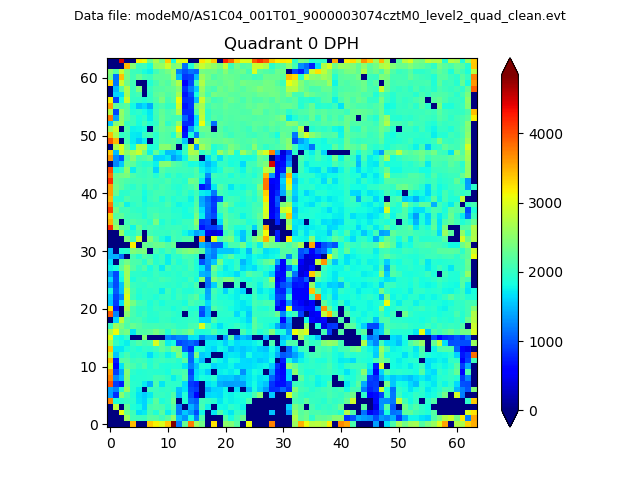 |
 |
Quadrant B |
|---|---|---|---|
| Quadrant D | 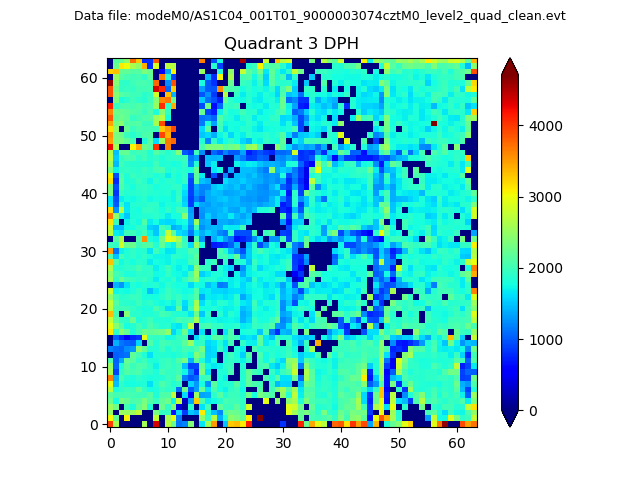 |
 |
Quadrant C |
| Plot type | Count rate plots | Images |
|---|---|---|
| Comparison with Poisson distribution Blue bars denote a histogram of data divided into 1 sec bins. Red curve is a Poisson curve with rate = median count rate of data. |
 |
 |
| Quadrant-wise count rates Data is divided into 100 sec bins |
 |
|
| Module-wise count rates for Quadrant A Data is divided into 100 sec bins |
 |
 |
| Module-wise count rates for Quadrant B Data is divided into 100 sec bins |
 |
 |
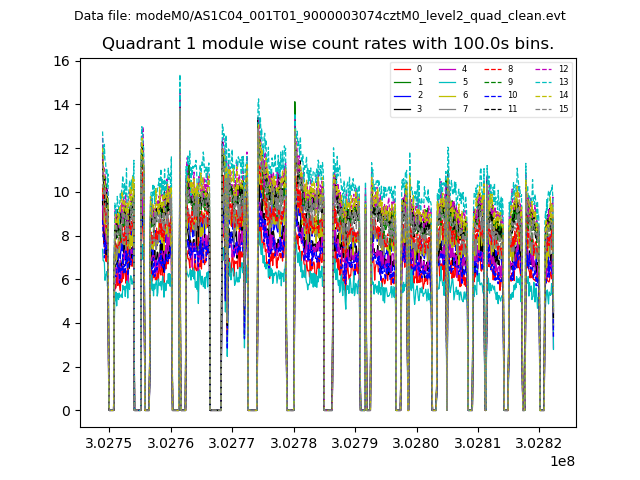
| Module-wise count rates for Quadrant C Data is divided into 100 sec bins |
 |
 |
| Module-wise count rates for Quadrant D Data is divided into 100 sec bins |
 |
 |
| Parameter | Plot |
|---|---|
| CZT HV Monitor |  |
| D_VDD |  |
| Temperature 1 |  |
| Veto HV Monitor |  |
| Veto LLD |  |
| Alpha Counter |  |
| _CPM_Rate |  |
| CZT Counter |  |
| +2.5 Volts monitor |  |
| +5 Volts monitor |  |
| _ROLL_ROT |  |
| _Roll_DEC |  |
| _Roll_RA |  |
| Veto Counter |  |