| Param | Original file | Final file |
|---|---|---|
| Filename | modeM0/AS1A05_013T01_9000003070cztM0_level2_bc.evt | modeM0/AS1A05_013T01_9000003070cztM0_level2_quad_clean.evt |
| Size (bytes) | 18,790,084,800 | 6,079,377,600 |
| Size | 17.5 GB | 5.7 GB |
| Events in quadrant A | 91,497,977 | 40,701,903 |
| Events in quadrant B | 106,810,892 | 40,096,286 |
| Events in quadrant C | 88,214,800 | 39,135,619 |
| Events in quadrant D | 254,289,817 | 35,749,486 |
| Mode SS | |||
|---|---|---|---|
| Quadrant | BADHDUFLAG | Total packets | Discarded packets |
| A | 0 | 8463 | 0 |
| B | 0 | 8465 | 0 |
| C | 0 | 8463 | 0 |
| D | 0 | 8462 | 0 |
| Mode M0 | |||
|---|---|---|---|
| Quadrant | BADHDUFLAG | Total packets | Discarded packets |
| A | 0 | 873638 | 0 |
| B | 0 | 936927 | 0 |
| C | 0 | 878165 | 0 |
| D | 0 | 1415896 | 0 |
| Mode M9 | |||
|---|---|---|---|
| Quadrant | BADHDUFLAG | Total packets | Discarded packets |
| A | 0 | 683 | 0 |
| B | 0 | 685 | 0 |
| C | 0 | 686 | 0 |
| D | 0 | 686 | 0 |
| Quadrant | Total seconds | Saturated seconds | Saturation percentage |
|---|---|---|---|
| A | 415652 | 4130 | 0.993620% |
| B | 415644 | 7854 | 1.889598% |
| C | 415638 | 6306 | 1.517186% |
| D | 415311 | 51273 | 12.345688% |
Noise dominated data is calculated using 1-second bins in cleaned event files. If a bin has >2000 counts, and if more than 50% of those come from <1% of pixels, then it is considered to be noise-dominated and hence unusable.
| Quadrant | # 1 sec bins | Bins with >0 counts | Bins with >2000 counts | High rate bins dominated by noise | Noise dominated (total time) | Noise dominated (detector-on time) | Marked lightcurve |
|---|---|---|---|---|---|---|---|
| A | 499184 | 416204 | 63 | 63 | 0.01% | 0.02% |  |
| B | 499184 | 416119 | 220 | 220 | 0.04% | 0.05% |  |
| C | 499184 | 416178 | 28 | 28 | 0.01% | 0.01% |  |
| D | 499184 | 415734 | 28360 | 28360 | 5.68% | 6.82% |  |
Top three noisy pixels from each quadrant. If the there are fewer than three noisy pixels in the level2.evt file, extra rows are filled as -1
| Pixel properties | Quadrant properties | ||||||
|---|---|---|---|---|---|---|---|
| Quadrant | DetID | PixID | Counts | Sigma | Mean | Median | Sigma |
| A | 5 | 16 | 1575923 | 308.81 | 23341 | 23026 | 5028.6 |
| A | 13 | 252 | 170480 | 29.32 | 23341 | 23026 | 5028.6 |
| A | 0 | 226 | 152652 | 25.78 | 23341 | 23026 | 5028.6 |
| B | 7 | 220 | 5644988 | 1319.9 | 22975 | 22512 | 4259.8 |
| B | 0 | 189 | 2352361 | 546.94 | 22975 | 22512 | 4259.8 |
| B | 3 | 64 | 2134146 | 495.72 | 22975 | 22512 | 4259.8 |
| C | 9 | 54 | 1936388 | 367.57 | 22173 | 22107 | 5208.0 |
| C | 3 | 233 | 523876 | 96.35 | 22173 | 22107 | 5208.0 |
| C | 7 | 247 | 500763 | 91.91 | 22173 | 22107 | 5208.0 |
| D | 1 | 52 | 93547369 | 18719.23 | 21593 | 20921 | 4996.3 |
| D | 1 | 20 | 48288262 | 9660.66 | 21593 | 20921 | 4996.3 |
| D | 12 | 227 | 11223547 | 2242.2 | 21593 | 20921 | 4996.3 |
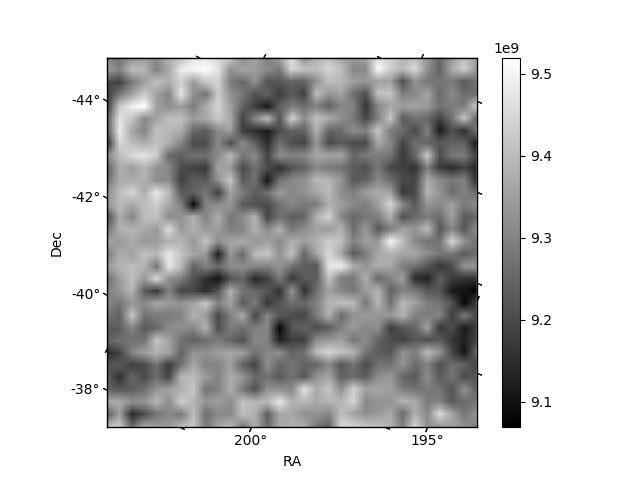
Histogram calculated using DETX and DETY for each event in the final _common_clean file
| Quadrant A |  |
 |
Quadrant B |
|---|---|---|---|
| Quadrant D |  |
 |
Quadrant C |
| Plot type | Count rate plots | Images |
|---|---|---|
| Comparison with Poisson distribution Blue bars denote a histogram of data divided into 1 sec bins. Red curve is a Poisson curve with rate = median count rate of data. |
 |
 |
| Quadrant-wise count rates Data is divided into 100 sec bins |
 |
|
| Module-wise count rates for Quadrant A Data is divided into 100 sec bins |
 |
 |
| Module-wise count rates for Quadrant B Data is divided into 100 sec bins |
 |
 |
| Module-wise count rates for Quadrant C Data is divided into 100 sec bins |
 |
 |
| Module-wise count rates for Quadrant D Data is divided into 100 sec bins |
 |
 |
| Parameter | Plot |
|---|---|
| CZT HV Monitor | 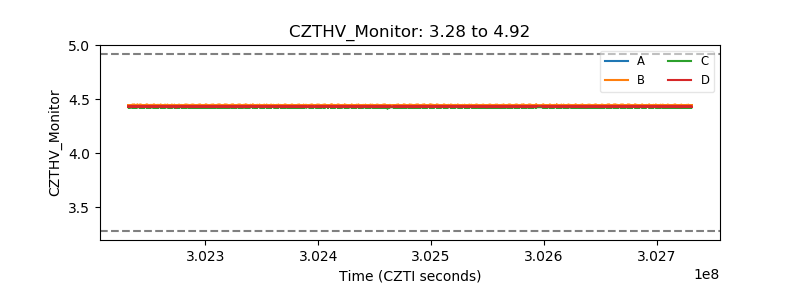 |
| D_VDD |  |
| Temperature 1 |  |
| Veto HV Monitor |  |
| Veto LLD |  |
| Alpha Counter |  |
| _CPM_Rate |  |
| CZT Counter |  |
| +2.5 Volts monitor | 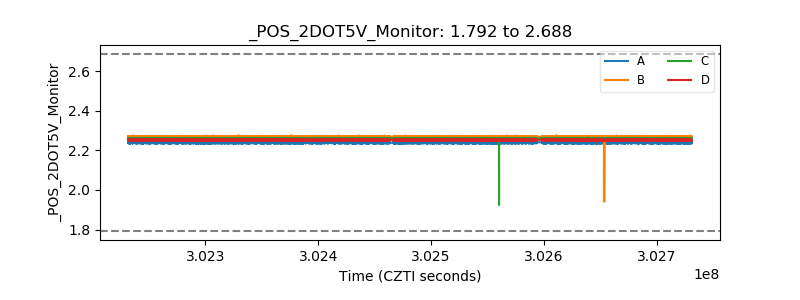 |
| +5 Volts monitor |  |
| _ROLL_ROT |  |
| _Roll_DEC |  |
| _Roll_RA |  |
| Veto Counter |  |