| Param | Original file | Final file |
|---|---|---|
| Filename | modeM0/AS1A05_063T03_9000003066cztM0_level2_bc.evt | modeM0/AS1A05_063T03_9000003066cztM0_level2_quad_clean.evt |
| Size (bytes) | 1,977,580,800 | 755,951,040 |
| Size | 1.8 GB | 720.9 MB |
| Events in quadrant A | 11,582,802 | 5,060,832 |
| Events in quadrant B | 12,799,819 | 4,962,556 |
| Events in quadrant C | 10,919,693 | 4,650,477 |
| Events in quadrant D | 21,071,312 | 4,683,306 |
| Mode M0 | |||
|---|---|---|---|
| Quadrant | BADHDUFLAG | Total packets | Discarded packets |
| A | 0 | 109489 | 0 |
| B | 0 | 115213 | 0 |
| C | 0 | 108831 | 0 |
| D | 0 | 140869 | 0 |
| Mode SS | |||
|---|---|---|---|
| Quadrant | BADHDUFLAG | Total packets | Discarded packets |
| A | 0 | 1058 | 0 |
| B | 0 | 1056 | 0 |
| C | 0 | 1055 | 0 |
| D | 0 | 1056 | 0 |
| Mode M9 | |||
|---|---|---|---|
| Quadrant | BADHDUFLAG | Total packets | Discarded packets |
| A | 0 | 98 | 0 |
| B | 0 | 98 | 0 |
| C | 0 | 98 | 0 |
| D | 0 | 98 | 0 |
| Quadrant | Total seconds | Saturated seconds | Saturation percentage |
|---|---|---|---|
| A | 51636 | 663 | 1.283988% |
| B | 51565 | 1029 | 1.995540% |
| C | 51628 | 894 | 1.731619% |
| D | 51544 | 2411 | 4.677557% |
Noise dominated data is calculated using 1-second bins in cleaned event files. If a bin has >2000 counts, and if more than 50% of those come from <1% of pixels, then it is considered to be noise-dominated and hence unusable.
| Quadrant | # 1 sec bins | Bins with >0 counts | Bins with >2000 counts | High rate bins dominated by noise | Noise dominated (total time) | Noise dominated (detector-on time) | Marked lightcurve |
|---|---|---|---|---|---|---|---|
| A | 67620 | 51816 | 0 | 0 | 0.00% | 0.00% |  |
| B | 67621 | 51709 | 16 | 16 | 0.02% | 0.03% | 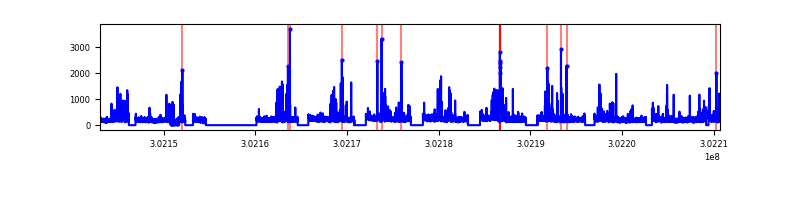 |
| C | 67621 | 51781 | 3 | 3 | 0.00% | 0.01% |  |
| D | 67621 | 51684 | 621 | 621 | 0.92% | 1.20% |  |
Top three noisy pixels from each quadrant. If the there are fewer than three noisy pixels in the level2.evt file, extra rows are filled as -1
| Pixel properties | Quadrant properties | ||||||
|---|---|---|---|---|---|---|---|
| Quadrant | DetID | PixID | Counts | Sigma | Mean | Median | Sigma |
| A | 6 | 240 | 130294 | 199.52 | 2980 | 2933 | 638.3 |
| A | 5 | 16 | 25327 | 35.08 | 2980 | 2933 | 638.3 |
| A | 0 | 226 | 19461 | 25.89 | 2980 | 2933 | 638.3 |
| B | 7 | 220 | 743034 | 1369.7 | 2935 | 2870 | 540.4 |
| B | 0 | 197 | 240165 | 439.12 | 2935 | 2870 | 540.4 |
| B | 0 | 229 | 151927 | 275.83 | 2935 | 2870 | 540.4 |
| C | 14 | 238 | 222987 | 329.54 | 2731 | 2690 | 668.5 |
| C | 3 | 233 | 105753 | 154.17 | 2731 | 2690 | 668.5 |
| C | 9 | 54 | 65862 | 94.5 | 2731 | 2690 | 668.5 |
| D | 1 | 52 | 4942819 | 7451.7 | 2886 | 2796 | 662.9 |
| D | 1 | 20 | 2095614 | 3156.88 | 2886 | 2796 | 662.9 |
| D | 5 | 222 | 2035986 | 3066.93 | 2886 | 2796 | 662.9 |
Histogram calculated using DETX and DETY for each event in the final _common_clean file
| Quadrant A |  |
 |
Quadrant B |
|---|---|---|---|
| Quadrant D |  |
 |
Quadrant C |
| Plot type | Count rate plots | Images |
|---|---|---|
| Comparison with Poisson distribution Blue bars denote a histogram of data divided into 1 sec bins. Red curve is a Poisson curve with rate = median count rate of data. |
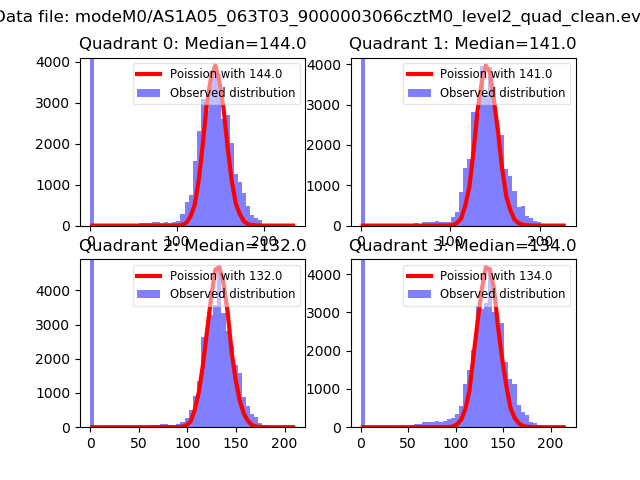 |
 |
| Quadrant-wise count rates Data is divided into 100 sec bins |
 |
|
| Module-wise count rates for Quadrant A Data is divided into 100 sec bins |
 |
 |
| Module-wise count rates for Quadrant B Data is divided into 100 sec bins |
 |
 |
| Module-wise count rates for Quadrant C Data is divided into 100 sec bins |
 |
 |
| Module-wise count rates for Quadrant D Data is divided into 100 sec bins |
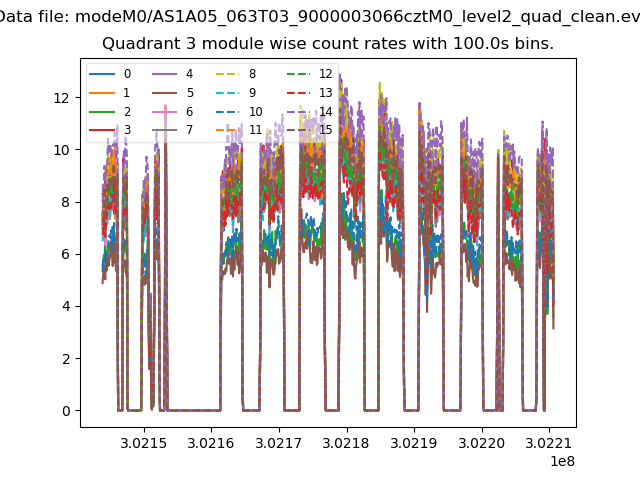 |
 |
| Parameter | Plot |
|---|---|
| CZT HV Monitor |  |
| D_VDD |  |
| Temperature 1 |  |
| Veto HV Monitor |  |
| Veto LLD |  |
| Alpha Counter |  |
| _CPM_Rate |  |
| CZT Counter |  |
| +2.5 Volts monitor |  |
| +5 Volts monitor |  |
| _ROLL_ROT |  |
| _Roll_DEC |  |
| _Roll_RA |  |
| Veto Counter |  |