| Param | Original file | Final file |
|---|---|---|
| Filename | modeM0/AS1A06_002T02_9000003064cztM0_level2_bc.evt | modeM0/AS1A06_002T02_9000003064cztM0_level2_quad_clean.evt |
| Size (bytes) | 949,501,440 | 364,152,960 |
| Size | 905.5 MB | 347.3 MB |
| Events in quadrant A | 5,434,010 | 2,363,805 |
| Events in quadrant B | 5,706,334 | 2,379,151 |
| Events in quadrant C | 5,628,945 | 2,222,068 |
| Events in quadrant D | 10,122,702 | 2,189,748 |
| Mode M9 | |||
|---|---|---|---|
| Quadrant | BADHDUFLAG | Total packets | Discarded packets |
| A | 0 | 25 | 0 |
| B | 0 | 25 | 0 |
| C | 0 | 25 | 0 |
| D | 0 | 25 | 0 |
| Mode M0 | |||
|---|---|---|---|
| Quadrant | BADHDUFLAG | Total packets | Discarded packets |
| A | 0 | 56188 | 0 |
| B | 0 | 56982 | 0 |
| C | 0 | 56599 | 0 |
| D | 0 | 70419 | 0 |
| Mode SS | |||
|---|---|---|---|
| Quadrant | BADHDUFLAG | Total packets | Discarded packets |
| A | 0 | 558 | 0 |
| B | 0 | 558 | 0 |
| C | 0 | 558 | 0 |
| D | 0 | 558 | 0 |
| Quadrant | Total seconds | Saturated seconds | Saturation percentage |
|---|---|---|---|
| A | 27263 | 192 | 0.704251% |
| B | 27263 | 300 | 1.100392% |
| C | 27263 | 388 | 1.423174% |
| D | 27263 | 554 | 2.032058% |
Noise dominated data is calculated using 1-second bins in cleaned event files. If a bin has >2000 counts, and if more than 50% of those come from <1% of pixels, then it is considered to be noise-dominated and hence unusable.
| Quadrant | # 1 sec bins | Bins with >0 counts | Bins with >2000 counts | High rate bins dominated by noise | Noise dominated (total time) | Noise dominated (detector-on time) | Marked lightcurve |
|---|---|---|---|---|---|---|---|
| A | 29878 | 27264 | 1 | 1 | 0.00% | 0.00% | 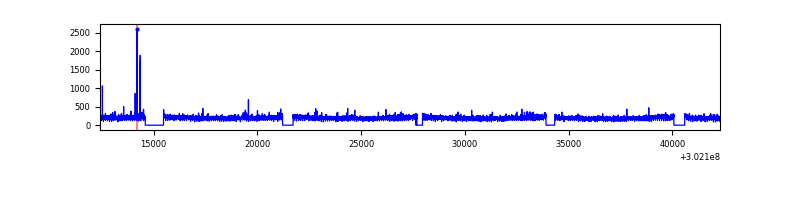 |
| B | 29878 | 27264 | 6 | 6 | 0.02% | 0.02% |  |
| C | 29878 | 27264 | 0 | 0 | 0.00% | 0.00% |  |
| D | 29878 | 27263 | 50 | 50 | 0.17% | 0.18% | 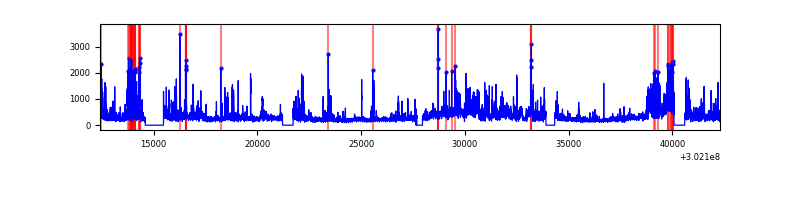 |
Top three noisy pixels from each quadrant. If the there are fewer than three noisy pixels in the level2.evt file, extra rows are filled as -1
| Pixel properties | Quadrant properties | ||||||
|---|---|---|---|---|---|---|---|
| Quadrant | DetID | PixID | Counts | Sigma | Mean | Median | Sigma |
| A | 6 | 240 | 16227 | 47.09 | 1408 | 1378 | 315.3 |
| A | 0 | 226 | 9135 | 24.6 | 1408 | 1378 | 315.3 |
| A | 12 | 194 | 8750 | 23.38 | 1408 | 1378 | 315.3 |
| B | 3 | 64 | 151230 | 534.93 | 1412 | 1369 | 280.1 |
| B | 10 | 247 | 29735 | 101.25 | 1412 | 1369 | 280.1 |
| B | 0 | 183 | 25873 | 87.47 | 1412 | 1369 | 280.1 |
| C | 7 | 247 | 380272 | 1193.35 | 1333 | 1322 | 317.6 |
| C | 3 | 233 | 114728 | 357.13 | 1333 | 1322 | 317.6 |
| C | 9 | 54 | 11916 | 33.36 | 1333 | 1322 | 317.6 |
| D | 1 | 20 | 2119619 | 6527.35 | 1366 | 1315 | 324.5 |
| D | 1 | 52 | 1810400 | 5574.52 | 1366 | 1315 | 324.5 |
| D | 5 | 222 | 303811 | 932.11 | 1366 | 1315 | 324.5 |
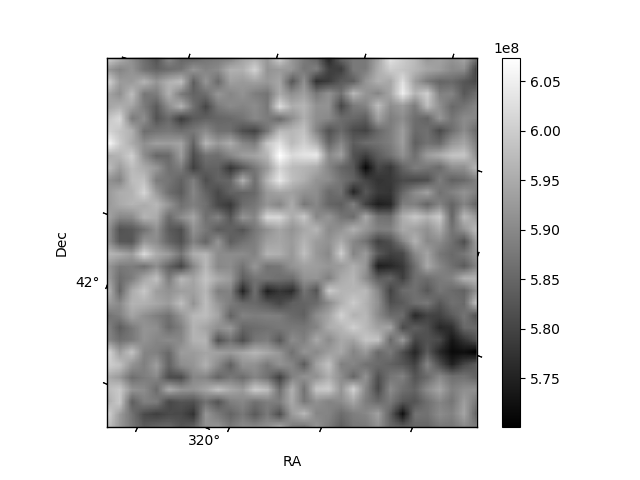
Histogram calculated using DETX and DETY for each event in the final _common_clean file
| Quadrant A |  |
 |
Quadrant B |
|---|---|---|---|
| Quadrant D |  |
 |
Quadrant C |
| Plot type | Count rate plots | Images |
|---|---|---|
| Comparison with Poisson distribution Blue bars denote a histogram of data divided into 1 sec bins. Red curve is a Poisson curve with rate = median count rate of data. |
 |
 |
| Quadrant-wise count rates Data is divided into 100 sec bins |
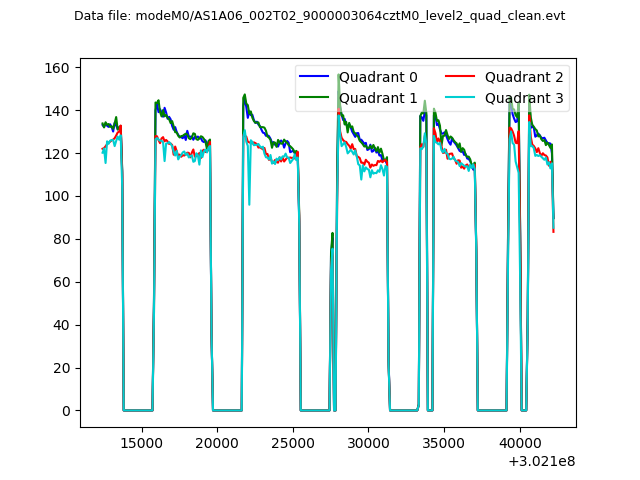 |
|
| Module-wise count rates for Quadrant A Data is divided into 100 sec bins |
 |
 |
| Module-wise count rates for Quadrant B Data is divided into 100 sec bins |
 |
 |
| Module-wise count rates for Quadrant C Data is divided into 100 sec bins |
 |
 |
| Module-wise count rates for Quadrant D Data is divided into 100 sec bins |
 |
 |
| Parameter | Plot |
|---|---|
| CZT HV Monitor |  |
| D_VDD |  |
| Temperature 1 |  |
| Veto HV Monitor |  |
| Veto LLD |  |
| Alpha Counter |  |
| _CPM_Rate |  |
| CZT Counter |  |
| +2.5 Volts monitor | 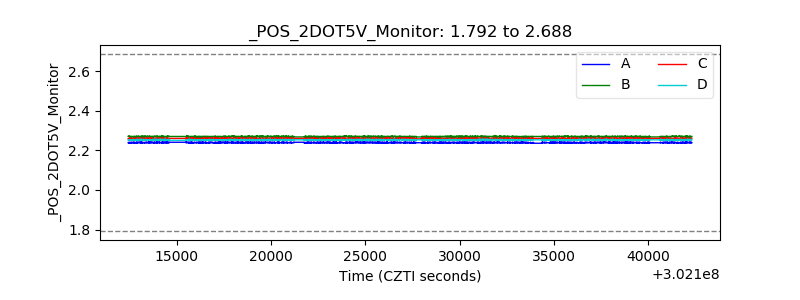 |
| +5 Volts monitor | 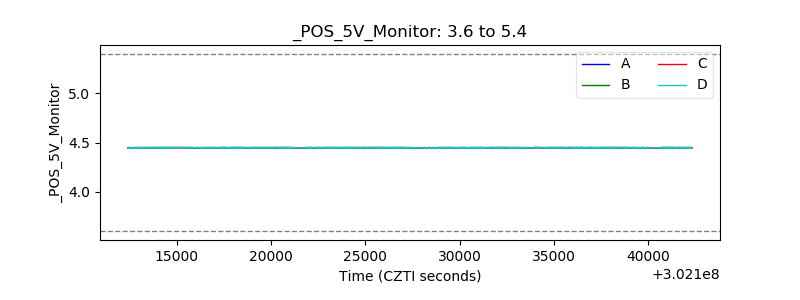 |
| _ROLL_ROT |  |
| _Roll_DEC |  |
| _Roll_RA |  |
| Veto Counter | 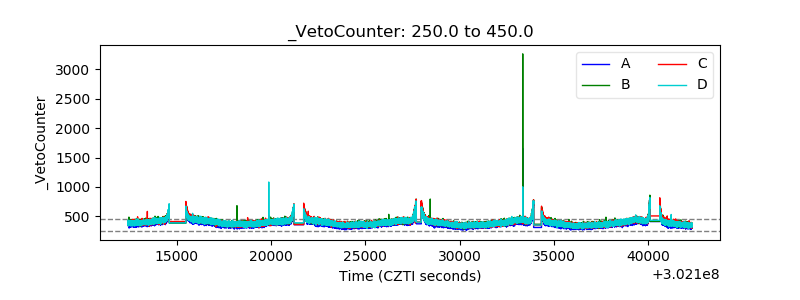 |