| Param | Original file | Final file |
|---|---|---|
| Filename | modeM0/AS1A05_165T07_9000003062cztM0_level2_bc.evt | modeM0/AS1A05_165T07_9000003062cztM0_level2_quad_clean.evt |
| Size (bytes) | 6,440,333,760 | 2,402,138,880 |
| Size | 6.0 GB | 2.2 GB |
| Events in quadrant A | 36,574,746 | 15,942,832 |
| Events in quadrant B | 40,958,811 | 15,685,657 |
| Events in quadrant C | 34,955,262 | 15,072,315 |
| Events in quadrant D | 71,208,592 | 14,636,587 |
| Mode SS | |||
|---|---|---|---|
| Quadrant | BADHDUFLAG | Total packets | Discarded packets |
| A | 0 | 3396 | 0 |
| B | 0 | 3396 | 0 |
| C | 0 | 3396 | 0 |
| D | 0 | 3396 | 0 |
| Mode M0 | |||
|---|---|---|---|
| Quadrant | BADHDUFLAG | Total packets | Discarded packets |
| A | 0 | 350692 | 0 |
| B | 0 | 371621 | 0 |
| C | 0 | 350564 | 0 |
| D | 0 | 468987 | 0 |
| Mode M9 | |||
|---|---|---|---|
| Quadrant | BADHDUFLAG | Total packets | Discarded packets |
| A | 0 | 308 | 0 |
| B | 0 | 308 | 0 |
| C | 0 | 308 | 0 |
| D | 0 | 308 | 0 |
| Quadrant | Total seconds | Saturated seconds | Saturation percentage |
|---|---|---|---|
| A | 166795 | 1756 | 1.052789% |
| B | 166795 | 3000 | 1.798615% |
| C | 166795 | 2435 | 1.459876% |
| D | 166794 | 8496 | 5.093708% |
Noise dominated data is calculated using 1-second bins in cleaned event files. If a bin has >2000 counts, and if more than 50% of those come from <1% of pixels, then it is considered to be noise-dominated and hence unusable.
| Quadrant | # 1 sec bins | Bins with >0 counts | Bins with >2000 counts | High rate bins dominated by noise | Noise dominated (total time) | Noise dominated (detector-on time) | Marked lightcurve |
|---|---|---|---|---|---|---|---|
| A | 197396 | 166797 | 12 | 12 | 0.01% | 0.01% |  |
| B | 197396 | 166796 | 38 | 38 | 0.02% | 0.02% |  |
| C | 197396 | 166795 | 1 | 1 | 0.00% | 0.00% |  |
| D | 197396 | 166794 | 2182 | 2182 | 1.11% | 1.31% |  |
Top three noisy pixels from each quadrant. If the there are fewer than three noisy pixels in the level2.evt file, extra rows are filled as -1
| Pixel properties | Quadrant properties | ||||||
|---|---|---|---|---|---|---|---|
| Quadrant | DetID | PixID | Counts | Sigma | Mean | Median | Sigma |
| A | 10 | 253 | 222276 | 105.69 | 9366 | 9224 | 2015.7 |
| A | 5 | 16 | 144466 | 67.09 | 9366 | 9224 | 2015.7 |
| A | 9 | 143 | 112011 | 50.99 | 9366 | 9224 | 2015.7 |
| B | 7 | 220 | 2789134 | 1608.26 | 9209 | 9004 | 1728.7 |
| B | 3 | 64 | 486040 | 275.96 | 9209 | 9004 | 1728.7 |
| B | 0 | 197 | 483173 | 274.3 | 9209 | 9004 | 1728.7 |
| C | 7 | 247 | 419986 | 200.23 | 8768 | 8725 | 2053.9 |
| C | 3 | 233 | 386850 | 184.1 | 8768 | 8725 | 2053.9 |
| C | 8 | 208 | 372134 | 176.93 | 8768 | 8725 | 2053.9 |
| D | 1 | 52 | 10947993 | 5314.01 | 8968 | 8685 | 2058.6 |
| D | 5 | 222 | 10541695 | 5116.64 | 8968 | 8685 | 2058.6 |
| D | 1 | 20 | 7459137 | 3619.22 | 8968 | 8685 | 2058.6 |
Histogram calculated using DETX and DETY for each event in the final _common_clean file
| Quadrant A |  |
 |
Quadrant B |
|---|---|---|---|
| Quadrant D |  |
 |
Quadrant C |
| Plot type | Count rate plots | Images |
|---|---|---|
| Comparison with Poisson distribution Blue bars denote a histogram of data divided into 1 sec bins. Red curve is a Poisson curve with rate = median count rate of data. |
 |
 |
| Quadrant-wise count rates Data is divided into 100 sec bins |
 |
|
| Module-wise count rates for Quadrant A Data is divided into 100 sec bins |
 |
 |
| Module-wise count rates for Quadrant B Data is divided into 100 sec bins |
 |
 |
| Module-wise count rates for Quadrant C Data is divided into 100 sec bins |
 |
 |
| Module-wise count rates for Quadrant D Data is divided into 100 sec bins |
 |
 |
| Parameter | Plot |
|---|---|
| CZT HV Monitor | 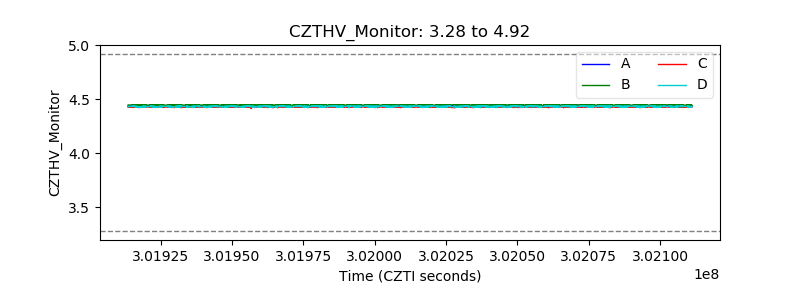 |
| D_VDD |  |
| Temperature 1 |  |
| Veto HV Monitor | 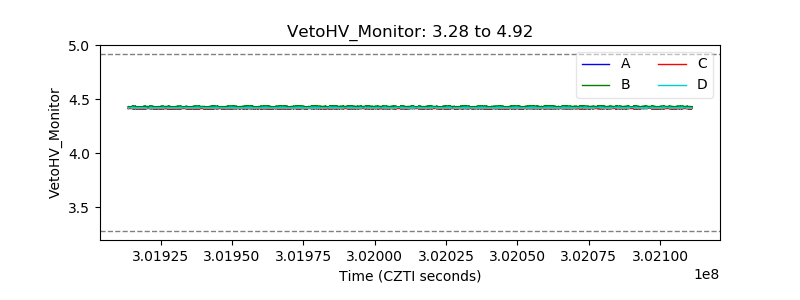 |
| Veto LLD | 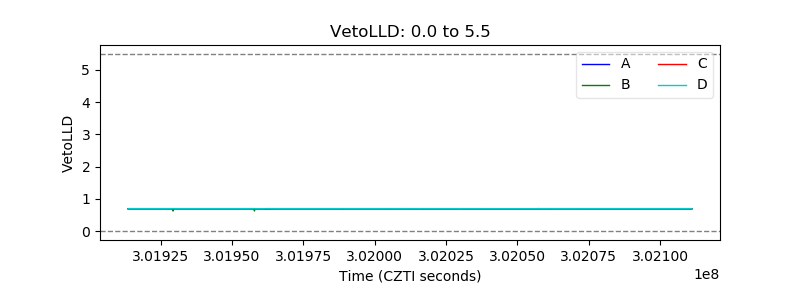 |
| Alpha Counter | 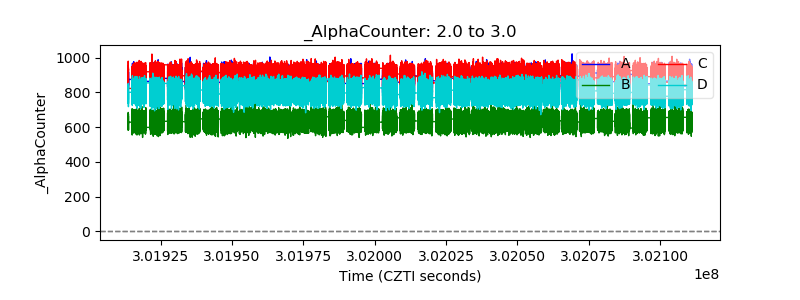 |
| _CPM_Rate | 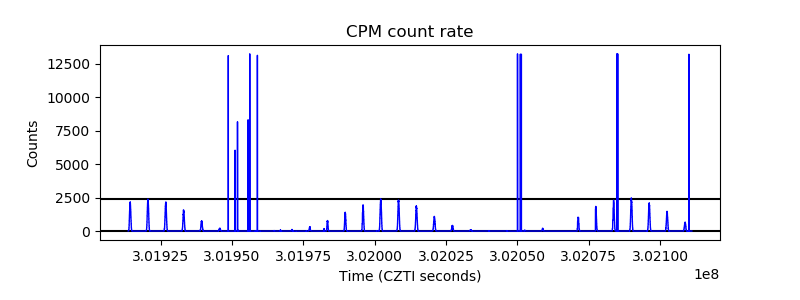 |
| CZT Counter |  |
| +2.5 Volts monitor |  |
| +5 Volts monitor |  |
| _ROLL_ROT |  |
| _Roll_DEC |  |
| _Roll_RA |  |
| Veto Counter |  |