| Param | Original file | Final file |
|---|---|---|
| Filename | modeM0/AS1A05_229T02_9000003060cztM0_level2_bc.evt | modeM0/AS1A05_229T02_9000003060cztM0_level2_quad_clean.evt |
| Size (bytes) | 6,064,966,080 | 2,292,108,480 |
| Size | 5.6 GB | 2.1 GB |
| Events in quadrant A | 36,425,447 | 14,950,738 |
| Events in quadrant B | 40,274,178 | 14,928,185 |
| Events in quadrant C | 34,912,617 | 14,497,466 |
| Events in quadrant D | 60,912,557 | 13,827,965 |
| Mode M0 | |||
|---|---|---|---|
| Quadrant | BADHDUFLAG | Total packets | Discarded packets |
| A | 0 | 346078 | 0 |
| B | 0 | 366414 | 0 |
| C | 0 | 345449 | 0 |
| D | 0 | 426264 | 0 |
| Mode SS | |||
|---|---|---|---|
| Quadrant | BADHDUFLAG | Total packets | Discarded packets |
| A | 0 | 3336 | 0 |
| B | 0 | 3338 | 0 |
| C | 0 | 3334 | 0 |
| D | 0 | 3334 | 0 |
| Mode M9 | |||
|---|---|---|---|
| Quadrant | BADHDUFLAG | Total packets | Discarded packets |
| A | 0 | 278 | 0 |
| B | 0 | 278 | 0 |
| C | 0 | 278 | 0 |
| D | 0 | 278 | 0 |
| Quadrant | Total seconds | Saturated seconds | Saturation percentage |
|---|---|---|---|
| A | 163856 | 1627 | 0.992945% |
| B | 163862 | 2908 | 1.774664% |
| C | 163857 | 2176 | 1.327987% |
| D | 163851 | 7542 | 4.602962% |
Noise dominated data is calculated using 1-second bins in cleaned event files. If a bin has >2000 counts, and if more than 50% of those come from <1% of pixels, then it is considered to be noise-dominated and hence unusable.
| Quadrant | # 1 sec bins | Bins with >0 counts | Bins with >2000 counts | High rate bins dominated by noise | Noise dominated (total time) | Noise dominated (detector-on time) | Marked lightcurve |
|---|---|---|---|---|---|---|---|
| A | 192471 | 163990 | 110 | 110 | 0.06% | 0.07% |  |
| B | 192471 | 163992 | 33 | 33 | 0.02% | 0.02% |  |
| C | 192472 | 163983 | 7 | 7 | 0.00% | 0.00% |  |
| D | 192472 | 163982 | 2296 | 2296 | 1.19% | 1.40% | 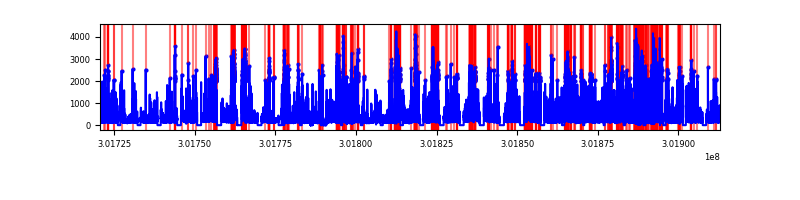 |
Top three noisy pixels from each quadrant. If the there are fewer than three noisy pixels in the level2.evt file, extra rows are filled as -1
| Pixel properties | Quadrant properties | ||||||
|---|---|---|---|---|---|---|---|
| Quadrant | DetID | PixID | Counts | Sigma | Mean | Median | Sigma |
| A | 5 | 16 | 1317454 | 672.22 | 9000 | 8850 | 1946.7 |
| A | 9 | 143 | 368093 | 184.54 | 9000 | 8850 | 1946.7 |
| A | 8 | 205 | 102743 | 48.23 | 9000 | 8850 | 1946.7 |
| B | 7 | 220 | 3377946 | 1988.08 | 9002 | 8798 | 1694.7 |
| B | 0 | 197 | 506493 | 293.68 | 9002 | 8798 | 1694.7 |
| B | 0 | 190 | 400516 | 231.15 | 9002 | 8798 | 1694.7 |
| C | 3 | 233 | 658508 | 321.37 | 8611 | 8596 | 2022.3 |
| C | 8 | 208 | 440013 | 213.33 | 8611 | 8596 | 2022.3 |
| C | 7 | 247 | 354388 | 170.99 | 8611 | 8596 | 2022.3 |
| D | 1 | 52 | 14383205 | 7189.93 | 8681 | 8404 | 1999.3 |
| D | 1 | 20 | 4203032 | 2098.05 | 8681 | 8404 | 1999.3 |
| D | 12 | 227 | 3187842 | 1590.28 | 8681 | 8404 | 1999.3 |
Histogram calculated using DETX and DETY for each event in the final _common_clean file
| Quadrant A |  |
 |
Quadrant B |
|---|---|---|---|
| Quadrant D |  |
 |
Quadrant C |
| Plot type | Count rate plots | Images |
|---|---|---|
| Comparison with Poisson distribution Blue bars denote a histogram of data divided into 1 sec bins. Red curve is a Poisson curve with rate = median count rate of data. |
 |
 |
| Quadrant-wise count rates Data is divided into 100 sec bins |
 |
|
| Module-wise count rates for Quadrant A Data is divided into 100 sec bins |
 |
 |
| Module-wise count rates for Quadrant B Data is divided into 100 sec bins |
 |
 |
| Module-wise count rates for Quadrant C Data is divided into 100 sec bins |
 |
 |
| Module-wise count rates for Quadrant D Data is divided into 100 sec bins |
 |
 |
| Parameter | Plot |
|---|---|
| CZT HV Monitor |  |
| D_VDD |  |
| Temperature 1 |  |
| Veto HV Monitor |  |
| Veto LLD | 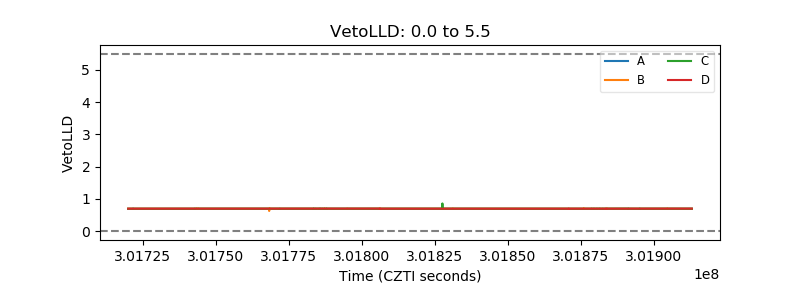 |
| Alpha Counter |  |
| _CPM_Rate |  |
| CZT Counter |  |
| +2.5 Volts monitor |  |
| +5 Volts monitor |  |
| _ROLL_ROT |  |
| _Roll_DEC |  |
| _Roll_RA | 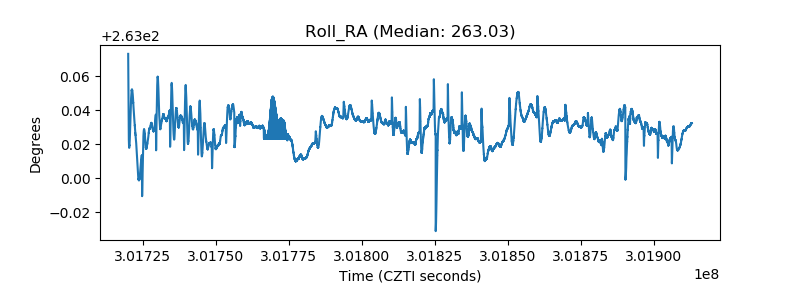 |
| Veto Counter |  |