| Param | Original file | Final file |
|---|---|---|
| Filename | modeM0/AS1A05_103T06_9000003056cztM0_level2_bc.evt | modeM0/AS1A05_103T06_9000003056cztM0_level2_quad_clean.evt |
| Size (bytes) | 530,127,360 | 211,089,600 |
| Size | 505.6 MB | 201.3 MB |
| Events in quadrant A | 3,113,674 | 1,407,512 |
| Events in quadrant B | 3,284,743 | 1,404,180 |
| Events in quadrant C | 2,929,725 | 1,330,300 |
| Events in quadrant D | 5,779,857 | 1,298,273 |
| Mode M9 | |||
|---|---|---|---|
| Quadrant | BADHDUFLAG | Total packets | Discarded packets |
| A | 0 | 36 | 0 |
| B | 0 | 36 | 0 |
| C | 0 | 36 | 0 |
| D | 0 | 36 | 0 |
| Mode M0 | |||
|---|---|---|---|
| Quadrant | BADHDUFLAG | Total packets | Discarded packets |
| A | 0 | 29250 | 0 |
| B | 0 | 29896 | 0 |
| C | 0 | 29113 | 0 |
| D | 0 | 37497 | 0 |
| Mode SS | |||
|---|---|---|---|
| Quadrant | BADHDUFLAG | Total packets | Discarded packets |
| A | 0 | 284 | 0 |
| B | 0 | 284 | 0 |
| C | 0 | 284 | 0 |
| D | 0 | 284 | 0 |
| Quadrant | Total seconds | Saturated seconds | Saturation percentage |
|---|---|---|---|
| A | 13802 | 214 | 1.550500% |
| B | 13801 | 210 | 1.521629% |
| C | 13802 | 258 | 1.869294% |
| D | 13802 | 332 | 2.405448% |
Noise dominated data is calculated using 1-second bins in cleaned event files. If a bin has >2000 counts, and if more than 50% of those come from <1% of pixels, then it is considered to be noise-dominated and hence unusable.
| Quadrant | # 1 sec bins | Bins with >0 counts | Bins with >2000 counts | High rate bins dominated by noise | Noise dominated (total time) | Noise dominated (detector-on time) | Marked lightcurve |
|---|---|---|---|---|---|---|---|
| A | 17512 | 13802 | 0 | 0 | 0.00% | 0.00% |  |
| B | 17512 | 13802 | 1 | 1 | 0.01% | 0.01% |  |
| C | 17512 | 13802 | 0 | 0 | 0.00% | 0.00% | 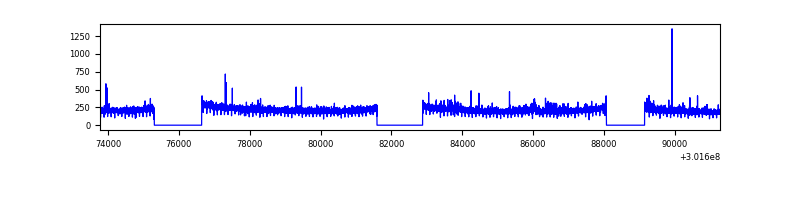 |
| D | 17512 | 13802 | 54 | 54 | 0.31% | 0.39% |  |
Top three noisy pixels from each quadrant. If the there are fewer than three noisy pixels in the level2.evt file, extra rows are filled as -1
| Pixel properties | Quadrant properties | ||||||
|---|---|---|---|---|---|---|---|
| Quadrant | DetID | PixID | Counts | Sigma | Mean | Median | Sigma |
| A | 13 | 210 | 37847 | 212.13 | 793 | 780 | 174.7 |
| A | 13 | 252 | 16037 | 87.32 | 793 | 780 | 174.7 |
| A | 5 | 16 | 9300 | 48.76 | 793 | 780 | 174.7 |
| B | 0 | 197 | 43090 | 277.71 | 791 | 773 | 152.4 |
| B | 0 | 244 | 36176 | 232.34 | 791 | 773 | 152.4 |
| B | 0 | 189 | 20859 | 131.82 | 791 | 773 | 152.4 |
| C | 7 | 247 | 41887 | 232.68 | 744 | 741 | 176.8 |
| C | 3 | 233 | 13716 | 73.37 | 744 | 741 | 176.8 |
| C | 8 | 208 | 9341 | 48.63 | 744 | 741 | 176.8 |
| D | 1 | 239 | 1338177 | 7467.25 | 766 | 740 | 179.1 |
| D | 1 | 52 | 852709 | 4756.76 | 766 | 740 | 179.1 |
| D | 1 | 20 | 332180 | 1850.51 | 766 | 740 | 179.1 |
Histogram calculated using DETX and DETY for each event in the final _common_clean file
| Quadrant A |  |
 |
Quadrant B |
|---|---|---|---|
| Quadrant D |  |
 |
Quadrant C |
| Plot type | Count rate plots | Images |
|---|---|---|
| Comparison with Poisson distribution Blue bars denote a histogram of data divided into 1 sec bins. Red curve is a Poisson curve with rate = median count rate of data. |
 |
 |
| Quadrant-wise count rates Data is divided into 100 sec bins |
 |
|
| Module-wise count rates for Quadrant A Data is divided into 100 sec bins |
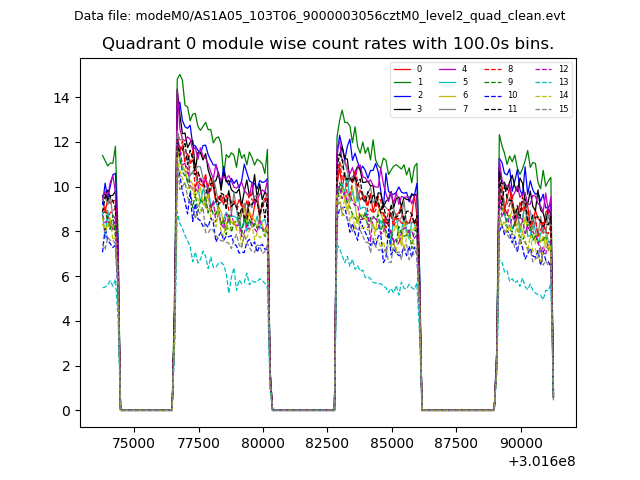 |
 |
| Module-wise count rates for Quadrant B Data is divided into 100 sec bins |
 |
 |
| Module-wise count rates for Quadrant C Data is divided into 100 sec bins |
 |
 |
| Module-wise count rates for Quadrant D Data is divided into 100 sec bins |
 |
 |
| Parameter | Plot |
|---|---|
| CZT HV Monitor |  |
| D_VDD |  |
| Temperature 1 |  |
| Veto HV Monitor |  |
| Veto LLD |  |
| Alpha Counter |  |
| _CPM_Rate |  |
| CZT Counter |  |
| +2.5 Volts monitor | 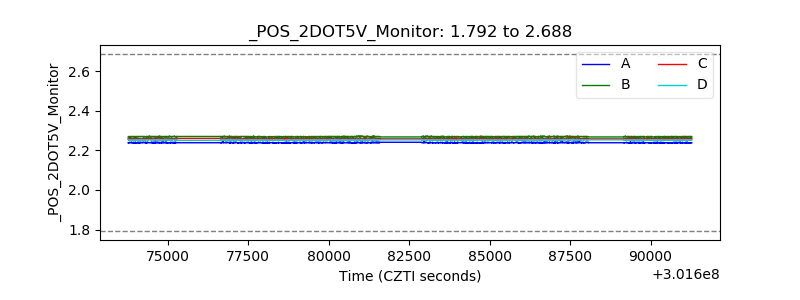 |
| +5 Volts monitor |  |
| _ROLL_ROT |  |
| _Roll_DEC | 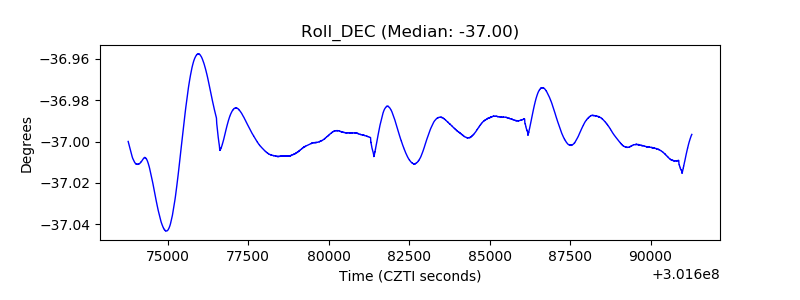 |
| _Roll_RA |  |
| Veto Counter |  |