| Param | Original file | Final file |
|---|---|---|
| Filename | modeM0/AS1A05_022T09_9000003058cztM0_level2_bc.evt | modeM0/AS1A05_022T09_9000003058cztM0_level2_quad_clean.evt |
| Size (bytes) | 800,821,440 | 408,888,000 |
| Size | 763.7 MB | 389.9 MB |
| Events in quadrant A | 5,123,487 | 2,704,348 |
| Events in quadrant B | 5,842,008 | 2,702,306 |
| Events in quadrant C | 4,893,853 | 2,660,423 |
| Events in quadrant D | 6,650,205 | 2,566,019 |
| Mode M0 | |||
|---|---|---|---|
| Quadrant | BADHDUFLAG | Total packets | Discarded packets |
| A | 0 | 52170 | 0 |
| B | 0 | 55630 | 0 |
| C | 0 | 51724 | 0 |
| D | 0 | 58141 | 0 |
| Mode M9 | |||
|---|---|---|---|
| Quadrant | BADHDUFLAG | Total packets | Discarded packets |
| A | 0 | 20 | 0 |
| B | 0 | 20 | 0 |
| C | 0 | 20 | 0 |
| D | 0 | 20 | 0 |
| Mode SS | |||
|---|---|---|---|
| Quadrant | BADHDUFLAG | Total packets | Discarded packets |
| A | 0 | 520 | 0 |
| B | 0 | 520 | 0 |
| C | 0 | 520 | 0 |
| D | 0 | 520 | 0 |
| Quadrant | Total seconds | Saturated seconds | Saturation percentage |
|---|---|---|---|
| A | 25475 | 120 | 0.471050% |
| B | 25475 | 423 | 1.660451% |
| C | 25475 | 210 | 0.824338% |
| D | 25475 | 746 | 2.928361% |
Noise dominated data is calculated using 1-second bins in cleaned event files. If a bin has >2000 counts, and if more than 50% of those come from <1% of pixels, then it is considered to be noise-dominated and hence unusable.
| Quadrant | # 1 sec bins | Bins with >0 counts | Bins with >2000 counts | High rate bins dominated by noise | Noise dominated (total time) | Noise dominated (detector-on time) | Marked lightcurve |
|---|---|---|---|---|---|---|---|
| A | 27460 | 25475 | 4 | 4 | 0.01% | 0.02% |  |
| B | 27460 | 25475 | 13 | 13 | 0.05% | 0.05% |  |
| C | 27460 | 25475 | 0 | 0 | 0.00% | 0.00% |  |
| D | 27460 | 25470 | 96 | 96 | 0.35% | 0.38% |  |
Top three noisy pixels from each quadrant. If the there are fewer than three noisy pixels in the level2.evt file, extra rows are filled as -1
| Pixel properties | Quadrant properties | ||||||
|---|---|---|---|---|---|---|---|
| Quadrant | DetID | PixID | Counts | Sigma | Mean | Median | Sigma |
| A | 5 | 16 | 144054 | 502.82 | 1279 | 1255 | 284.0 |
| A | 8 | 205 | 32501 | 110.02 | 1279 | 1255 | 284.0 |
| A | 12 | 16 | 15860 | 51.43 | 1279 | 1255 | 284.0 |
| B | 7 | 220 | 467262 | 1884.88 | 1277 | 1241 | 247.2 |
| B | 6 | 36 | 68657 | 272.67 | 1277 | 1241 | 247.2 |
| B | 3 | 64 | 63882 | 253.36 | 1277 | 1241 | 247.2 |
| C | 7 | 247 | 64990 | 210.92 | 1247 | 1239 | 302.2 |
| C | 5 | 4 | 14687 | 44.49 | 1247 | 1239 | 302.2 |
| C | 3 | 233 | 11694 | 34.59 | 1247 | 1239 | 302.2 |
| D | 1 | 52 | 628175 | 2121.96 | 1252 | 1206 | 295.5 |
| D | 1 | 20 | 290300 | 978.43 | 1252 | 1206 | 295.5 |
| D | 1 | 239 | 285376 | 961.77 | 1252 | 1206 | 295.5 |
Histogram calculated using DETX and DETY for each event in the final _common_clean file
| Quadrant A |  |
 |
Quadrant B |
|---|---|---|---|
| Quadrant D |  |
 |
Quadrant C |
| Plot type | Count rate plots | Images |
|---|---|---|
| Comparison with Poisson distribution Blue bars denote a histogram of data divided into 1 sec bins. Red curve is a Poisson curve with rate = median count rate of data. |
 |
 |
| Quadrant-wise count rates Data is divided into 100 sec bins |
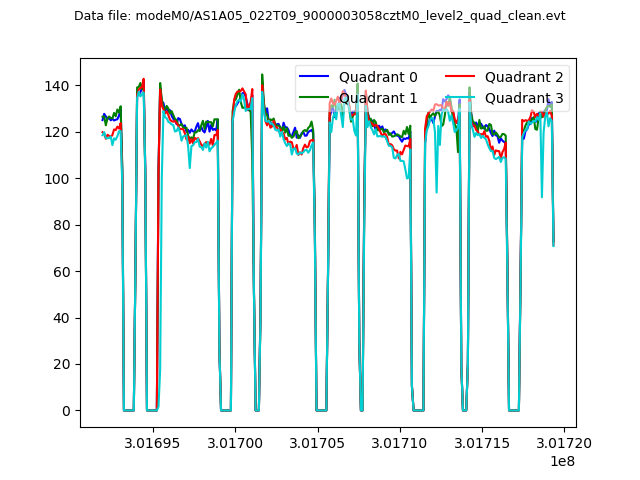 |
|
| Module-wise count rates for Quadrant A Data is divided into 100 sec bins |
 |
 |
| Module-wise count rates for Quadrant B Data is divided into 100 sec bins |
 |
 |
| Module-wise count rates for Quadrant C Data is divided into 100 sec bins |
 |
 |
| Module-wise count rates for Quadrant D Data is divided into 100 sec bins |
 |
 |
| Parameter | Plot |
|---|---|
| CZT HV Monitor | 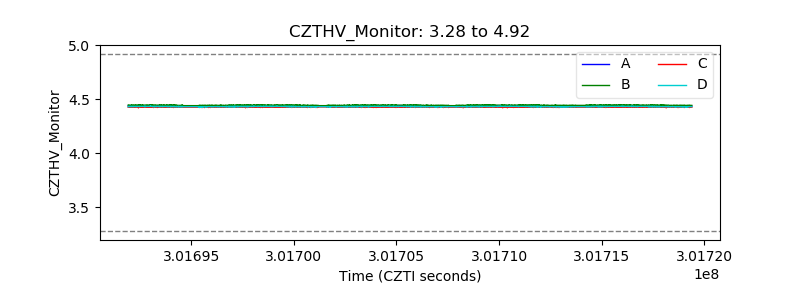 |
| D_VDD |  |
| Temperature 1 |  |
| Veto HV Monitor |  |
| Veto LLD | 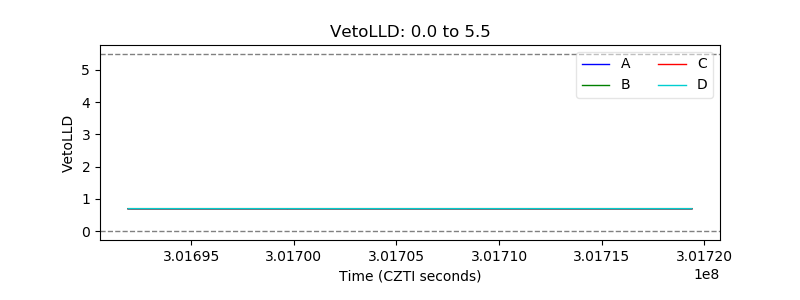 |
| Alpha Counter |  |
| _CPM_Rate |  |
| CZT Counter |  |
| +2.5 Volts monitor | 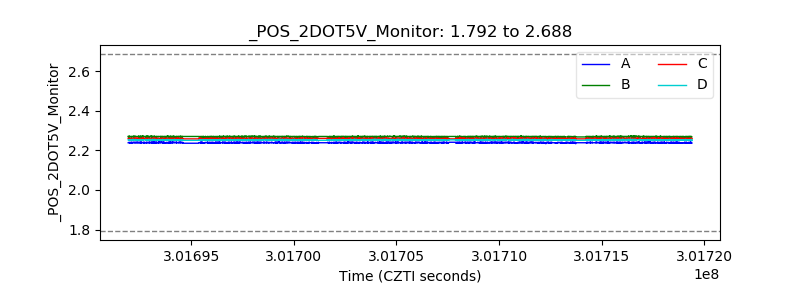 |
| +5 Volts monitor |  |
| _ROLL_ROT |  |
| _Roll_DEC |  |
| _Roll_RA |  |
| Veto Counter |  |