| Param | Original file | Final file |
|---|---|---|
| Filename | modeM0/AS1A05_103T05_9000003052cztM0_level2_bc.evt | modeM0/AS1A05_103T05_9000003052cztM0_level2_quad_clean.evt |
| Size (bytes) | 666,855,360 | 261,155,520 |
| Size | 636.0 MB | 249.1 MB |
| Events in quadrant A | 4,334,062 | 1,693,516 |
| Events in quadrant B | 4,492,662 | 1,690,111 |
| Events in quadrant C | 3,931,225 | 1,627,040 |
| Events in quadrant D | 6,131,657 | 1,585,263 |
| Mode M0 | |||
|---|---|---|---|
| Quadrant | BADHDUFLAG | Total packets | Discarded packets |
| A | 0 | 40675 | 0 |
| B | 0 | 41282 | 0 |
| C | 0 | 39646 | 0 |
| D | 0 | 46156 | 0 |
| Mode M9 | |||
|---|---|---|---|
| Quadrant | BADHDUFLAG | Total packets | Discarded packets |
| A | 0 | 41 | 0 |
| B | 0 | 41 | 0 |
| C | 0 | 41 | 0 |
| D | 0 | 41 | 0 |
| Mode SS | |||
|---|---|---|---|
| Quadrant | BADHDUFLAG | Total packets | Discarded packets |
| A | 0 | 388 | 0 |
| B | 0 | 390 | 0 |
| C | 0 | 390 | 0 |
| D | 0 | 390 | 0 |
| Quadrant | Total seconds | Saturated seconds | Saturation percentage |
|---|---|---|---|
| A | 19078 | 203 | 1.064053% |
| B | 19075 | 254 | 1.331586% |
| C | 19070 | 250 | 1.310960% |
| D | 19082 | 264 | 1.383503% |
Noise dominated data is calculated using 1-second bins in cleaned event files. If a bin has >2000 counts, and if more than 50% of those come from <1% of pixels, then it is considered to be noise-dominated and hence unusable.
| Quadrant | # 1 sec bins | Bins with >0 counts | Bins with >2000 counts | High rate bins dominated by noise | Noise dominated (total time) | Noise dominated (detector-on time) | Marked lightcurve |
|---|---|---|---|---|---|---|---|
| A | 23189 | 19092 | 0 | 0 | 0.00% | 0.00% | 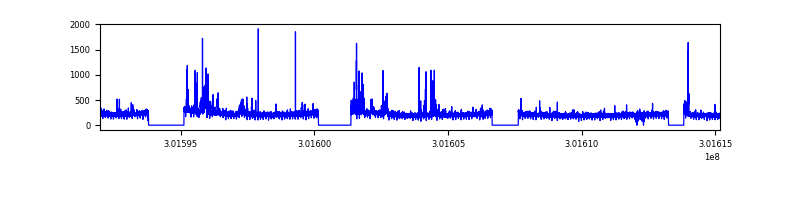 |
| B | 23189 | 19092 | 4 | 4 | 0.02% | 0.02% | 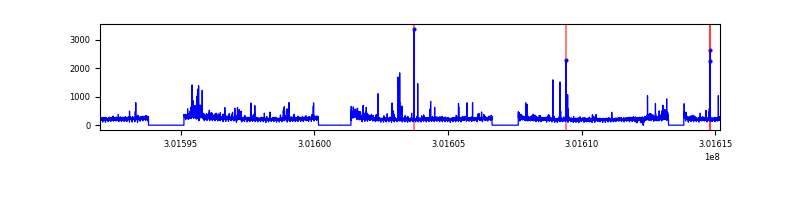 |
| C | 23189 | 19089 | 0 | 0 | 0.00% | 0.00% |  |
| D | 23189 | 19092 | 19 | 19 | 0.08% | 0.10% | 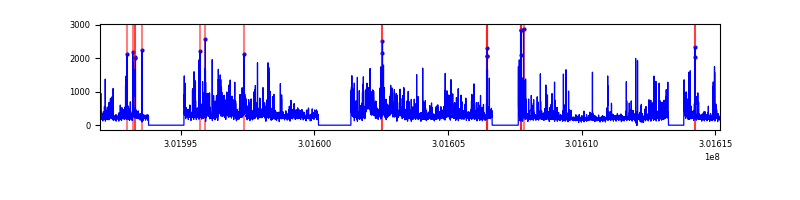 |
Top three noisy pixels from each quadrant. If the there are fewer than three noisy pixels in the level2.evt file, extra rows are filled as -1
| Pixel properties | Quadrant properties | ||||||
|---|---|---|---|---|---|---|---|
| Quadrant | DetID | PixID | Counts | Sigma | Mean | Median | Sigma |
| A | 12 | 16 | 168924 | 725.83 | 1044 | 1026 | 231.3 |
| A | 5 | 16 | 106649 | 456.61 | 1044 | 1026 | 231.3 |
| A | 12 | 194 | 35206 | 147.76 | 1044 | 1026 | 231.3 |
| B | 7 | 220 | 104682 | 521.0 | 1043 | 1019 | 199.0 |
| B | 0 | 219 | 92858 | 461.58 | 1043 | 1019 | 199.0 |
| B | 0 | 189 | 52149 | 256.98 | 1043 | 1019 | 199.0 |
| C | 7 | 247 | 53716 | 223.15 | 993 | 987 | 236.3 |
| C | 3 | 9 | 29650 | 121.3 | 993 | 987 | 236.3 |
| C | 3 | 233 | 19956 | 80.28 | 993 | 987 | 236.3 |
| D | 1 | 52 | 1427641 | 5971.42 | 1014 | 978 | 238.9 |
| D | 7 | 238 | 299086 | 1247.76 | 1014 | 978 | 238.9 |
| D | 2 | 165 | 203439 | 847.42 | 1014 | 978 | 238.9 |
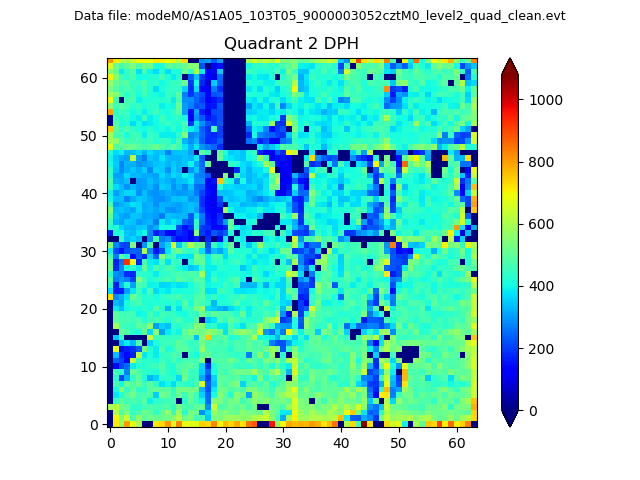
Histogram calculated using DETX and DETY for each event in the final _common_clean file
| Quadrant A |  |
 |
Quadrant B |
|---|---|---|---|
| Quadrant D | 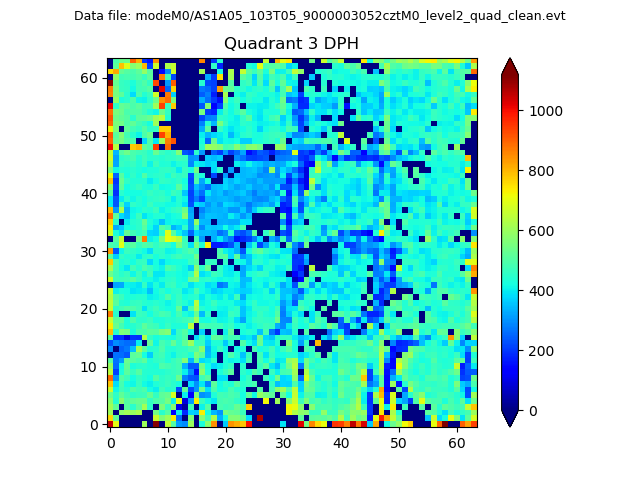 |
 |
Quadrant C |
| Plot type | Count rate plots | Images |
|---|---|---|
| Comparison with Poisson distribution Blue bars denote a histogram of data divided into 1 sec bins. Red curve is a Poisson curve with rate = median count rate of data. |
 |
 |
| Quadrant-wise count rates Data is divided into 100 sec bins |
 |
|
| Module-wise count rates for Quadrant A Data is divided into 100 sec bins |
 |
 |
| Module-wise count rates for Quadrant B Data is divided into 100 sec bins |
 |
 |
| Module-wise count rates for Quadrant C Data is divided into 100 sec bins |
 |
 |
| Module-wise count rates for Quadrant D Data is divided into 100 sec bins |
 |
 |
| Parameter | Plot |
|---|---|
| CZT HV Monitor |  |
| D_VDD | 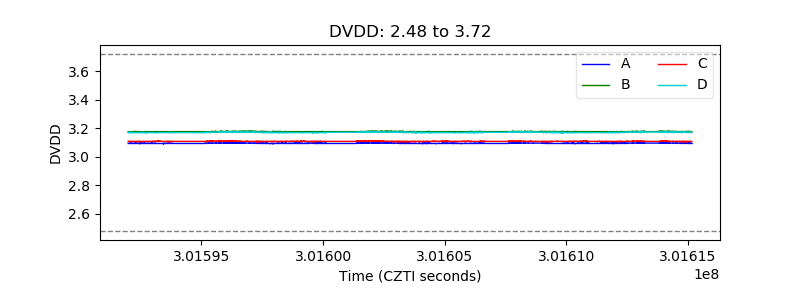 |
| Temperature 1 |  |
| Veto HV Monitor |  |
| Veto LLD |  |
| Alpha Counter |  |
| _CPM_Rate |  |
| CZT Counter |  |
| +2.5 Volts monitor | 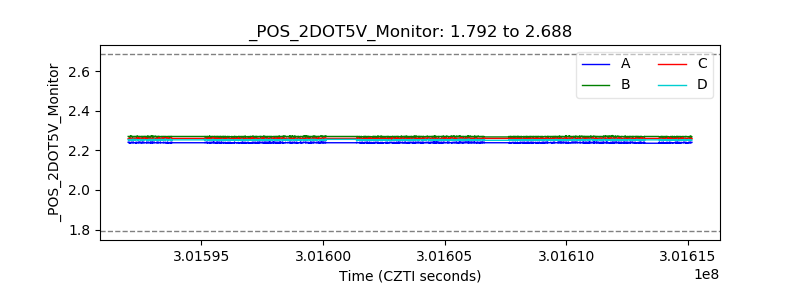 |
| +5 Volts monitor | 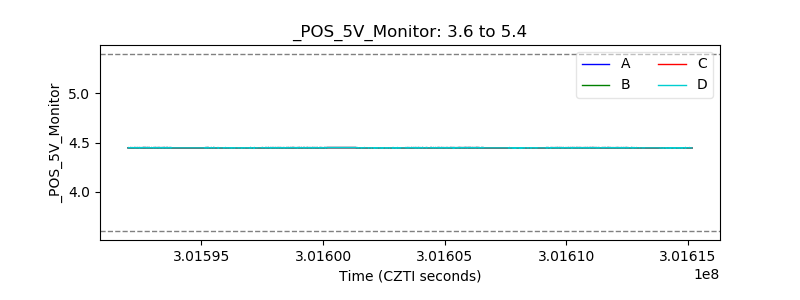 |
| _ROLL_ROT |  |
| _Roll_DEC | 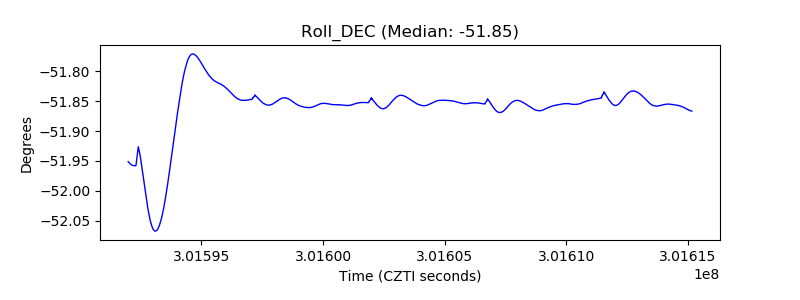 |
| _Roll_RA |  |
| Veto Counter |  |