| Param | Original file | Final file |
|---|---|---|
| Filename | modeM0/AS1A05_082T09_9000003054cztM0_level2_bc.evt | modeM0/AS1A05_082T09_9000003054cztM0_level2_quad_clean.evt |
| Size (bytes) | 2,002,642,560 | 688,530,240 |
| Size | 1.9 GB | 656.6 MB |
| Events in quadrant A | 14,110,299 | 4,478,659 |
| Events in quadrant B | 12,457,768 | 4,517,554 |
| Events in quadrant C | 10,306,954 | 4,326,935 |
| Events in quadrant D | 20,402,294 | 4,136,004 |
| Mode M9 | |||
|---|---|---|---|
| Quadrant | BADHDUFLAG | Total packets | Discarded packets |
| A | 0 | 73 | 0 |
| B | 0 | 73 | 0 |
| C | 0 | 73 | 0 |
| D | 0 | 73 | 0 |
| Mode M0 | |||
|---|---|---|---|
| Quadrant | BADHDUFLAG | Total packets | Discarded packets |
| A | 0 | 119014 | 0 |
| B | 0 | 111472 | 0 |
| C | 0 | 103631 | 0 |
| D | 0 | 137695 | 0 |
| Mode SS | |||
|---|---|---|---|
| Quadrant | BADHDUFLAG | Total packets | Discarded packets |
| A | 0 | 1006 | 0 |
| B | 0 | 1006 | 0 |
| C | 0 | 1006 | 0 |
| D | 0 | 1006 | 0 |
| Quadrant | Total seconds | Saturated seconds | Saturation percentage |
|---|---|---|---|
| A | 49492 | 1887 | 3.812737% |
| B | 49492 | 978 | 1.976077% |
| C | 49489 | 777 | 1.570046% |
| D | 49492 | 2411 | 4.871494% |
Noise dominated data is calculated using 1-second bins in cleaned event files. If a bin has >2000 counts, and if more than 50% of those come from <1% of pixels, then it is considered to be noise-dominated and hence unusable.
| Quadrant | # 1 sec bins | Bins with >0 counts | Bins with >2000 counts | High rate bins dominated by noise | Noise dominated (total time) | Noise dominated (detector-on time) | Marked lightcurve |
|---|---|---|---|---|---|---|---|
| A | 56754 | 49493 | 103 | 103 | 0.18% | 0.21% | 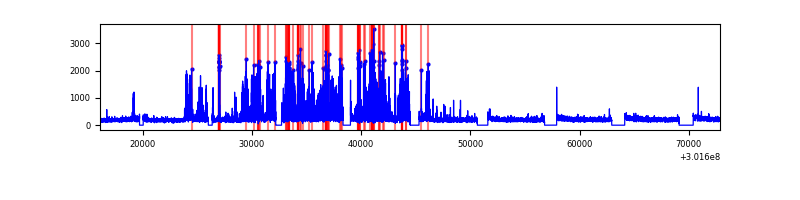 |
| B | 56754 | 49491 | 5 | 5 | 0.01% | 0.01% |  |
| C | 56754 | 49492 | 4 | 4 | 0.01% | 0.01% |  |
| D | 56754 | 49490 | 641 | 641 | 1.13% | 1.30% |  |
Top three noisy pixels from each quadrant. If the there are fewer than three noisy pixels in the level2.evt file, extra rows are filled as -1
| Pixel properties | Quadrant properties | ||||||
|---|---|---|---|---|---|---|---|
| Quadrant | DetID | PixID | Counts | Sigma | Mean | Median | Sigma |
| A | 5 | 16 | 3955355 | 6891.35 | 2620 | 2571 | 573.6 |
| A | 12 | 16 | 48401 | 79.9 | 2620 | 2571 | 573.6 |
| A | 13 | 252 | 29910 | 47.66 | 2620 | 2571 | 573.6 |
| B | 7 | 220 | 807059 | 1591.14 | 2641 | 2571 | 505.6 |
| B | 0 | 244 | 226928 | 443.74 | 2641 | 2571 | 505.6 |
| B | 0 | 190 | 208553 | 407.4 | 2641 | 2571 | 505.6 |
| C | 7 | 247 | 188424 | 311.99 | 2517 | 2501 | 595.9 |
| C | 8 | 208 | 136515 | 224.88 | 2517 | 2501 | 595.9 |
| C | 0 | 207 | 135830 | 223.73 | 2517 | 2501 | 595.9 |
| D | 1 | 52 | 4070726 | 6876.62 | 2548 | 2457 | 591.6 |
| D | 1 | 20 | 3412118 | 5763.37 | 2548 | 2457 | 591.6 |
| D | 1 | 239 | 682824 | 1150.03 | 2548 | 2457 | 591.6 |
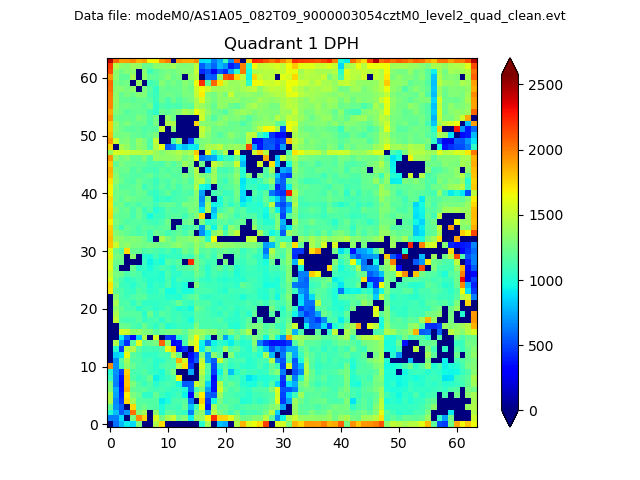
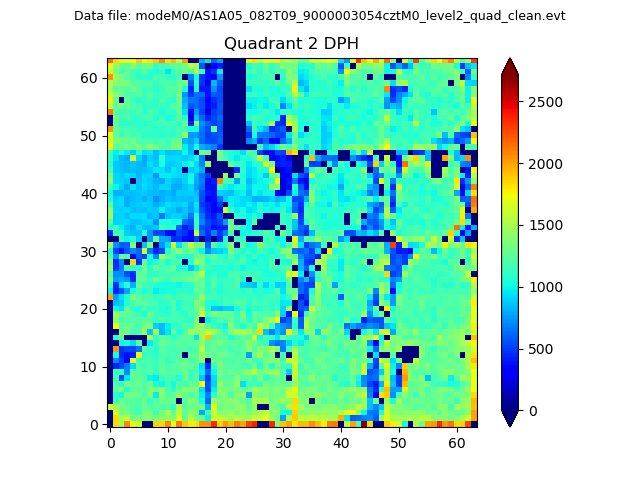
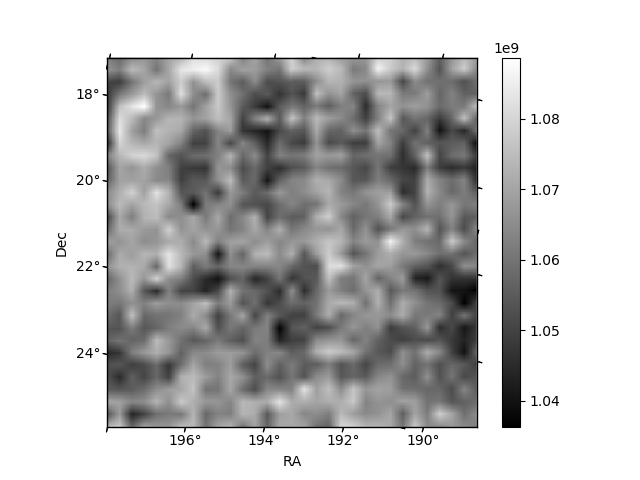
Histogram calculated using DETX and DETY for each event in the final _common_clean file
| Quadrant A |  |
 |
Quadrant B |
|---|---|---|---|
| Quadrant D | 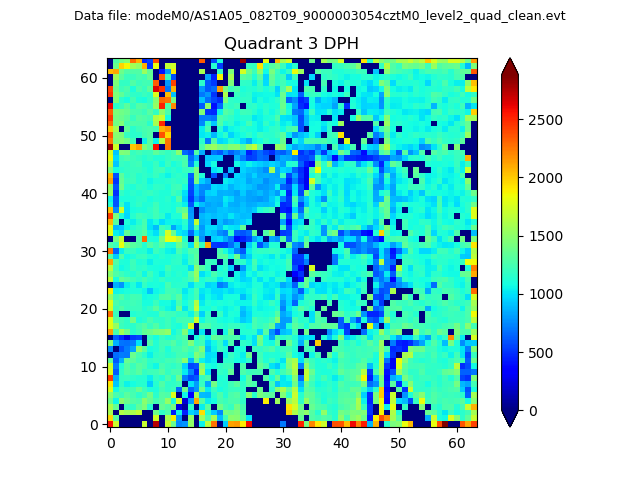 |
 |
Quadrant C |
| Plot type | Count rate plots | Images |
|---|---|---|
| Comparison with Poisson distribution Blue bars denote a histogram of data divided into 1 sec bins. Red curve is a Poisson curve with rate = median count rate of data. |
 |
 |
| Quadrant-wise count rates Data is divided into 100 sec bins |
 |
|
| Module-wise count rates for Quadrant A Data is divided into 100 sec bins |
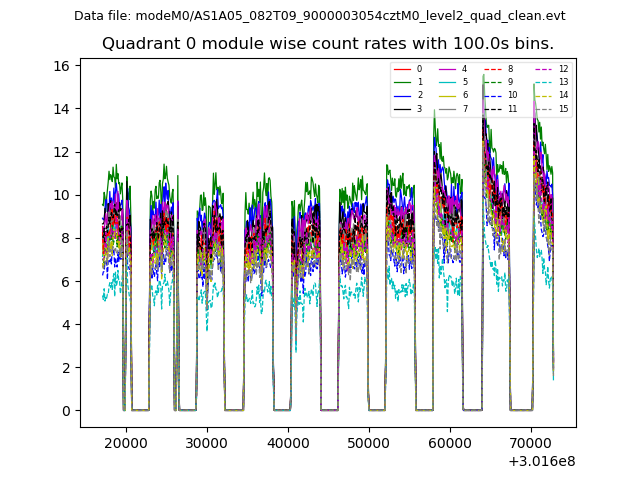 |
 |
| Module-wise count rates for Quadrant B Data is divided into 100 sec bins |
 |
 |
| Module-wise count rates for Quadrant C Data is divided into 100 sec bins |
 |
 |
| Module-wise count rates for Quadrant D Data is divided into 100 sec bins |
 |
 |
| Parameter | Plot |
|---|---|
| CZT HV Monitor |  |
| D_VDD |  |
| Temperature 1 |  |
| Veto HV Monitor |  |
| Veto LLD | 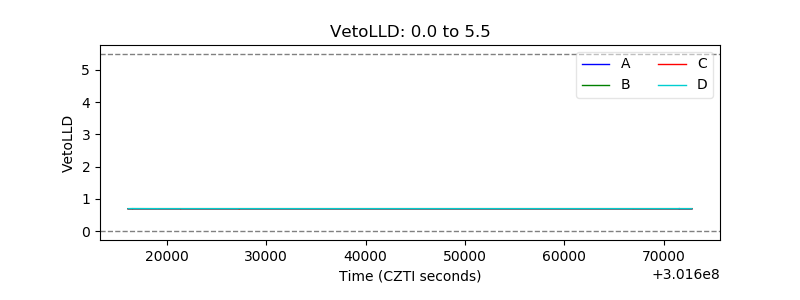 |
| Alpha Counter |  |
| _CPM_Rate | 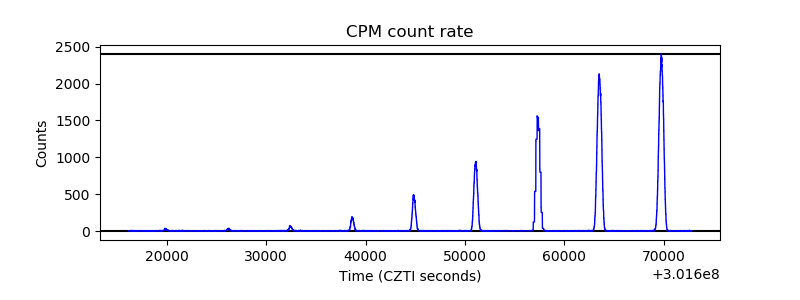 |
| CZT Counter | 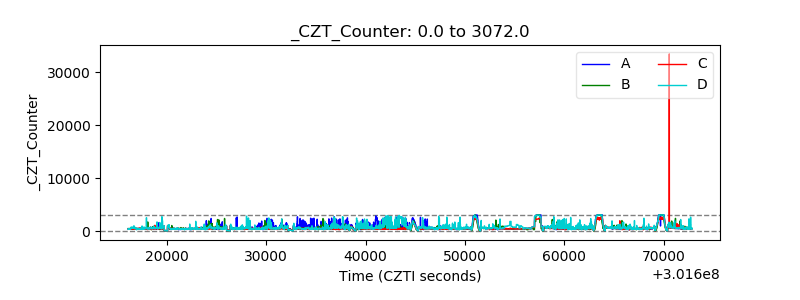 |
| +2.5 Volts monitor |  |
| +5 Volts monitor |  |
| _ROLL_ROT | 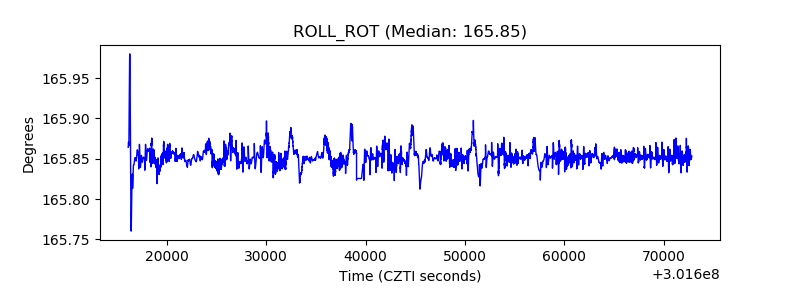 |
| _Roll_DEC |  |
| _Roll_RA | 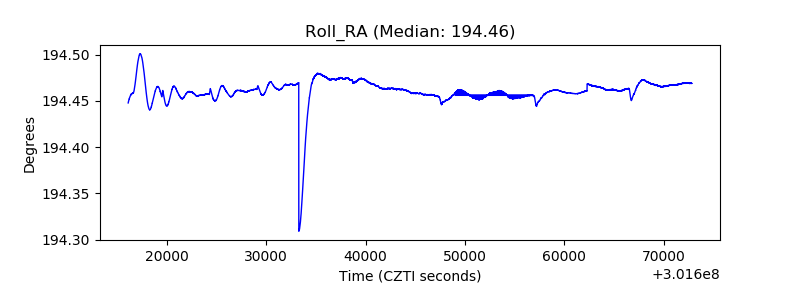 |
| Veto Counter | 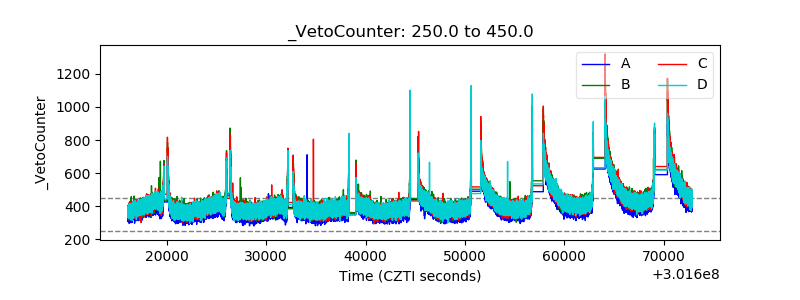 |