| Param | Original file | Final file |
|---|---|---|
| Filename | modeM0/AS1A05_007T06_9000003050cztM0_level2_bc.evt | modeM0/AS1A05_007T06_9000003050cztM0_level2_quad_clean.evt |
| Size (bytes) | 2,270,488,320 | 858,553,920 |
| Size | 2.1 GB | 818.8 MB |
| Events in quadrant A | 12,695,562 | 5,741,756 |
| Events in quadrant B | 14,100,452 | 5,668,836 |
| Events in quadrant C | 13,276,318 | 5,479,404 |
| Events in quadrant D | 24,663,020 | 5,063,360 |
| Mode SS | |||
|---|---|---|---|
| Quadrant | BADHDUFLAG | Total packets | Discarded packets |
| A | 0 | 1200 | 0 |
| B | 0 | 1202 | 0 |
| C | 0 | 1200 | 0 |
| D | 0 | 1204 | 0 |
| Mode M9 | |||
|---|---|---|---|
| Quadrant | BADHDUFLAG | Total packets | Discarded packets |
| A | 0 | 91 | 0 |
| B | 0 | 91 | 0 |
| C | 0 | 91 | 0 |
| D | 0 | 91 | 0 |
| Mode M0 | |||
|---|---|---|---|
| Quadrant | BADHDUFLAG | Total packets | Discarded packets |
| A | 0 | 123808 | 0 |
| B | 0 | 129683 | 0 |
| C | 0 | 126247 | 0 |
| D | 0 | 174864 | 0 |
| Quadrant | Total seconds | Saturated seconds | Saturation percentage |
|---|---|---|---|
| A | 59052 | 608 | 1.029601% |
| B | 59068 | 937 | 1.586307% |
| C | 59065 | 866 | 1.466181% |
| D | 59066 | 5520 | 9.345478% |
Noise dominated data is calculated using 1-second bins in cleaned event files. If a bin has >2000 counts, and if more than 50% of those come from <1% of pixels, then it is considered to be noise-dominated and hence unusable.
| Quadrant | # 1 sec bins | Bins with >0 counts | Bins with >2000 counts | High rate bins dominated by noise | Noise dominated (total time) | Noise dominated (detector-on time) | Marked lightcurve |
|---|---|---|---|---|---|---|---|
| A | 68112 | 59105 | 4 | 4 | 0.01% | 0.01% |  |
| B | 68112 | 59124 | 16 | 16 | 0.02% | 0.03% |  |
| C | 68112 | 59135 | 1 | 1 | 0.00% | 0.00% |  |
| D | 68112 | 59113 | 839 | 839 | 1.23% | 1.42% |  |
Top three noisy pixels from each quadrant. If the there are fewer than three noisy pixels in the level2.evt file, extra rows are filled as -1
| Pixel properties | Quadrant properties | ||||||
|---|---|---|---|---|---|---|---|
| Quadrant | DetID | PixID | Counts | Sigma | Mean | Median | Sigma |
| A | 5 | 16 | 459055 | 665.3 | 3158 | 3102 | 685.3 |
| A | 12 | 16 | 68093 | 94.83 | 3158 | 3102 | 685.3 |
| A | 12 | 194 | 32485 | 42.87 | 3158 | 3102 | 685.3 |
| B | 7 | 220 | 652717 | 1103.05 | 3128 | 3053 | 589.0 |
| B | 4 | 216 | 275414 | 462.44 | 3128 | 3053 | 589.0 |
| B | 0 | 197 | 244257 | 409.53 | 3128 | 3053 | 589.0 |
| C | 8 | 208 | 1473667 | 2044.71 | 3022 | 3007 | 719.3 |
| C | 7 | 247 | 91146 | 122.54 | 3022 | 3007 | 719.3 |
| C | 3 | 233 | 64562 | 85.58 | 3022 | 3007 | 719.3 |
| D | 1 | 52 | 7148062 | 10275.91 | 2962 | 2860 | 695.3 |
| D | 1 | 20 | 2568416 | 3689.67 | 2962 | 2860 | 695.3 |
| D | 12 | 227 | 1275941 | 1830.89 | 2962 | 2860 | 695.3 |
Histogram calculated using DETX and DETY for each event in the final _common_clean file
| Quadrant A |  |
 |
Quadrant B |
|---|---|---|---|
| Quadrant D | 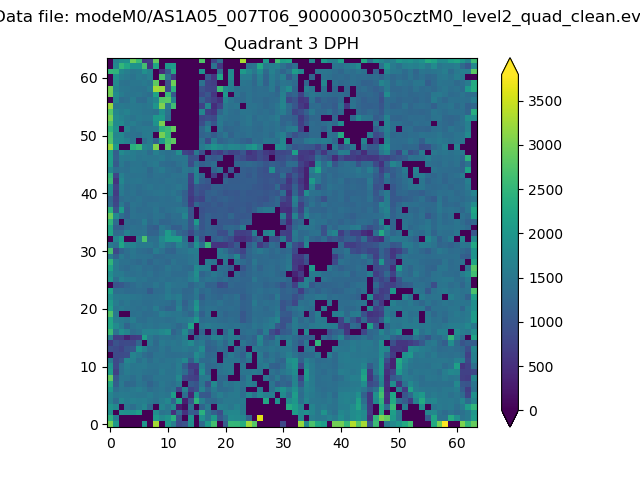 |
 |
Quadrant C |
| Plot type | Count rate plots | Images |
|---|---|---|
| Comparison with Poisson distribution Blue bars denote a histogram of data divided into 1 sec bins. Red curve is a Poisson curve with rate = median count rate of data. |
 |
 |
| Quadrant-wise count rates Data is divided into 100 sec bins |
 |
|
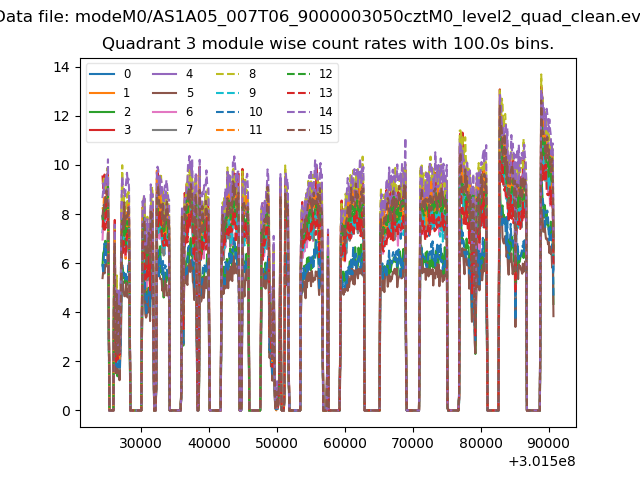
| Module-wise count rates for Quadrant A Data is divided into 100 sec bins |
 |
 |
| Module-wise count rates for Quadrant B Data is divided into 100 sec bins |
 |
 |
| Module-wise count rates for Quadrant C Data is divided into 100 sec bins |
 |
 |
| Module-wise count rates for Quadrant D Data is divided into 100 sec bins |
 |
 |
| Parameter | Plot |
|---|---|
| CZT HV Monitor |  |
| D_VDD |  |
| Temperature 1 |  |
| Veto HV Monitor | 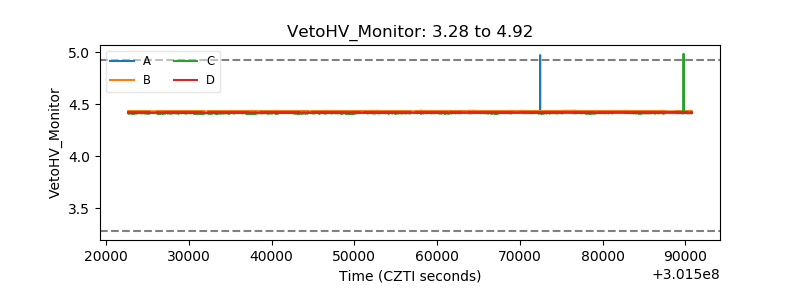 |
| Veto LLD |  |
| Alpha Counter | 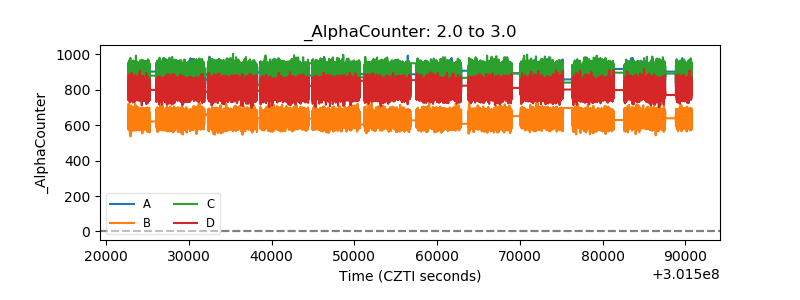 |
| _CPM_Rate | 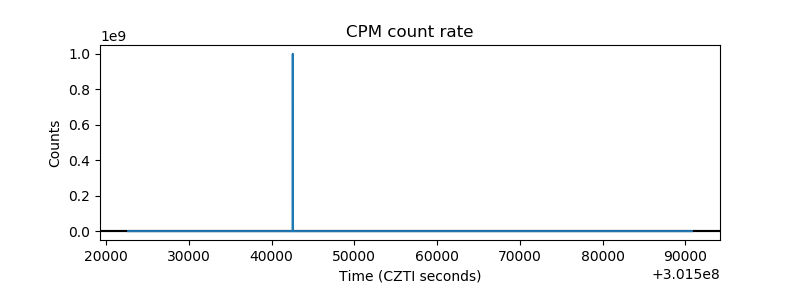 |
| CZT Counter |  |
| +2.5 Volts monitor |  |
| +5 Volts monitor |  |
| _ROLL_ROT |  |
| _Roll_DEC |  |
| _Roll_RA |  |
| Veto Counter |  |