| Param | Original file | Final file |
|---|---|---|
| Filename | modeM0/AS1A06_005T02_9000003048cztM0_level2_bc.evt | modeM0/AS1A06_005T02_9000003048cztM0_level2_quad_clean.evt |
| Size (bytes) | 2,960,187,840 | 975,729,600 |
| Size | 2.8 GB | 930.5 MB |
| Events in quadrant A | 16,020,858 | 6,496,357 |
| Events in quadrant B | 16,845,100 | 6,440,497 |
| Events in quadrant C | 16,649,167 | 6,166,054 |
| Events in quadrant D | 35,487,375 | 5,769,501 |
| Mode M9 | |||
|---|---|---|---|
| Quadrant | BADHDUFLAG | Total packets | Discarded packets |
| A | 0 | 119 | 0 |
| B | 0 | 119 | 0 |
| C | 0 | 119 | 0 |
| D | 0 | 119 | 0 |
| Mode M0 | |||
|---|---|---|---|
| Quadrant | BADHDUFLAG | Total packets | Discarded packets |
| A | 0 | 146666 | 0 |
| B | 0 | 150980 | 0 |
| C | 0 | 150200 | 0 |
| D | 0 | 214548 | 0 |
| Mode SS | |||
|---|---|---|---|
| Quadrant | BADHDUFLAG | Total packets | Discarded packets |
| A | 0 | 1392 | 0 |
| B | 0 | 1392 | 0 |
| C | 0 | 1392 | 0 |
| D | 0 | 1392 | 0 |
| Quadrant | Total seconds | Saturated seconds | Saturation percentage |
|---|---|---|---|
| A | 68276 | 624 | 0.913938% |
| B | 68276 | 1054 | 1.543734% |
| C | 68276 | 1002 | 1.467573% |
| D | 68276 | 6143 | 8.997305% |
Noise dominated data is calculated using 1-second bins in cleaned event files. If a bin has >2000 counts, and if more than 50% of those come from <1% of pixels, then it is considered to be noise-dominated and hence unusable.
| Quadrant | # 1 sec bins | Bins with >0 counts | Bins with >2000 counts | High rate bins dominated by noise | Noise dominated (total time) | Noise dominated (detector-on time) | Marked lightcurve |
|---|---|---|---|---|---|---|---|
| A | 80046 | 68277 | 11 | 11 | 0.01% | 0.02% | 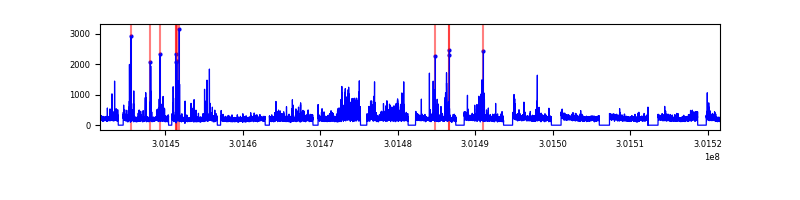 |
| B | 80046 | 68275 | 86 | 86 | 0.11% | 0.13% |  |
| C | 80046 | 68279 | 5 | 5 | 0.01% | 0.01% | 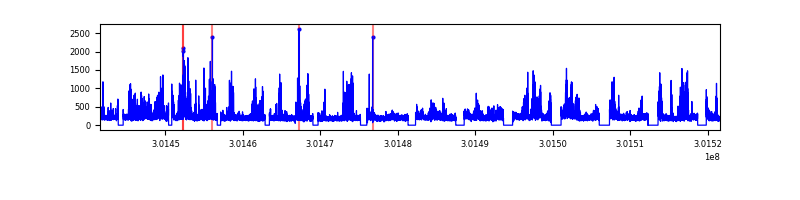 |
| D | 80046 | 68278 | 2226 | 2226 | 2.78% | 3.26% |  |
Top three noisy pixels from each quadrant. If the there are fewer than three noisy pixels in the level2.evt file, extra rows are filled as -1
| Pixel properties | Quadrant properties | ||||||
|---|---|---|---|---|---|---|---|
| Quadrant | DetID | PixID | Counts | Sigma | Mean | Median | Sigma |
| A | 12 | 16 | 902008 | 1100.3 | 3749 | 3676 | 816.4 |
| A | 5 | 16 | 444001 | 539.32 | 3749 | 3676 | 816.4 |
| A | 12 | 194 | 177340 | 212.71 | 3749 | 3676 | 816.4 |
| B | 7 | 220 | 740011 | 1044.0 | 3724 | 3636 | 705.3 |
| B | 3 | 64 | 433822 | 609.9 | 3724 | 3636 | 705.3 |
| B | 0 | 190 | 216121 | 301.25 | 3724 | 3636 | 705.3 |
| C | 8 | 208 | 1371234 | 1642.76 | 3537 | 3517 | 832.6 |
| C | 3 | 233 | 841268 | 1006.22 | 3537 | 3517 | 832.6 |
| C | 3 | 9 | 694267 | 829.66 | 3537 | 3517 | 832.6 |
| D | 1 | 52 | 9876357 | 12082.91 | 3514 | 3395 | 817.1 |
| D | 5 | 222 | 5239990 | 6408.75 | 3514 | 3395 | 817.1 |
| D | 1 | 20 | 2867703 | 3505.45 | 3514 | 3395 | 817.1 |
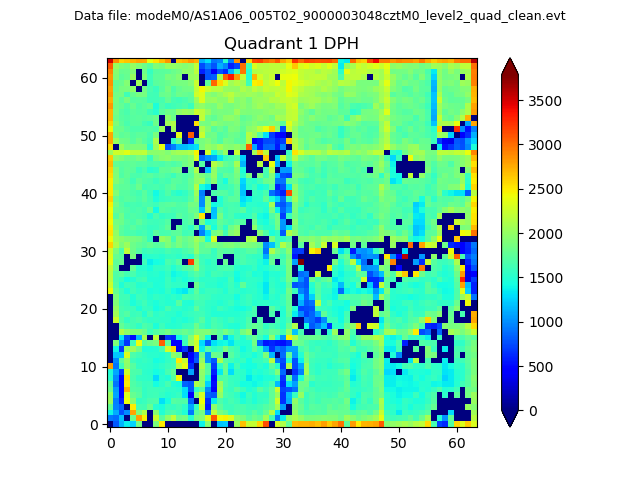
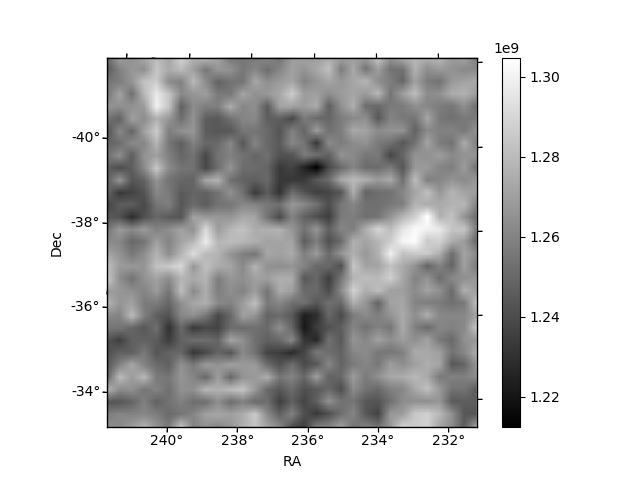
Histogram calculated using DETX and DETY for each event in the final _common_clean file
| Quadrant A |  |
 |
Quadrant B |
|---|---|---|---|
| Quadrant D |  |
 |
Quadrant C |
| Plot type | Count rate plots | Images |
|---|---|---|
| Comparison with Poisson distribution Blue bars denote a histogram of data divided into 1 sec bins. Red curve is a Poisson curve with rate = median count rate of data. |
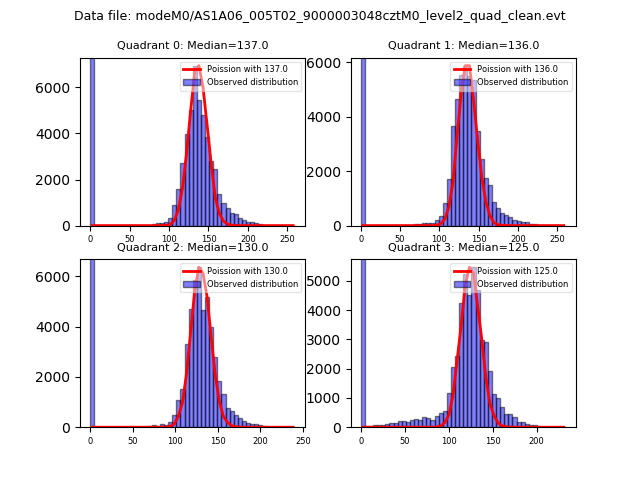 |
 |
| Quadrant-wise count rates Data is divided into 100 sec bins |
 |
|
| Module-wise count rates for Quadrant A Data is divided into 100 sec bins |
 |
 |
| Module-wise count rates for Quadrant B Data is divided into 100 sec bins |
 |
 |
| Module-wise count rates for Quadrant C Data is divided into 100 sec bins |
 |
 |
| Module-wise count rates for Quadrant D Data is divided into 100 sec bins |
 |
 |
| Parameter | Plot |
|---|---|
| CZT HV Monitor |  |
| D_VDD |  |
| Temperature 1 |  |
| Veto HV Monitor | 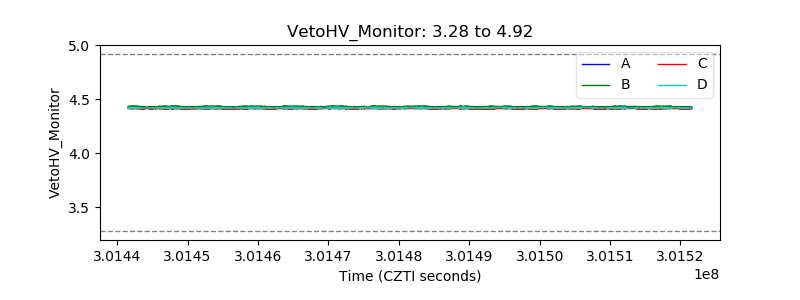 |
| Veto LLD |  |
| Alpha Counter |  |
| _CPM_Rate |  |
| CZT Counter |  |
| +2.5 Volts monitor |  |
| +5 Volts monitor |  |
| _ROLL_ROT |  |
| _Roll_DEC |  |
| _Roll_RA |  |
| Veto Counter | 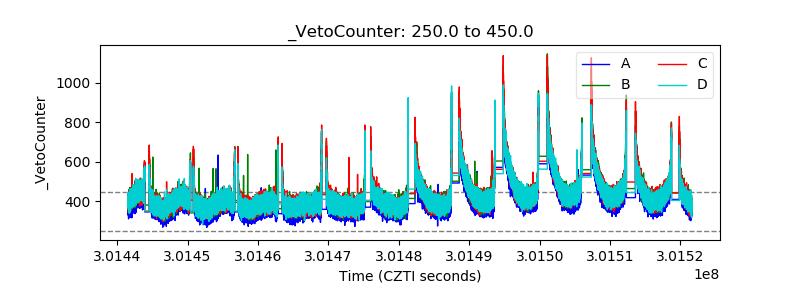 |