| Param | Original file | Final file |
|---|---|---|
| Filename | modeM0/AS1A06_003T04_9000003046cztM0_level2_bc.evt | modeM0/AS1A06_003T04_9000003046cztM0_level2_quad_clean.evt |
| Size (bytes) | 7,529,362,560 | 2,466,705,600 |
| Size | 7.0 GB | 2.3 GB |
| Events in quadrant A | 41,701,558 | 15,717,187 |
| Events in quadrant B | 48,135,019 | 15,941,510 |
| Events in quadrant C | 44,611,504 | 15,384,879 |
| Events in quadrant D | 80,809,465 | 14,813,010 |
| Mode M0 | |||
|---|---|---|---|
| Quadrant | BADHDUFLAG | Total packets | Discarded packets |
| A | 0 | 398663 | 0 |
| B | 0 | 429017 | 0 |
| C | 0 | 413106 | 0 |
| D | 0 | 540004 | 0 |
| Mode SS | |||
|---|---|---|---|
| Quadrant | BADHDUFLAG | Total packets | Discarded packets |
| A | 0 | 3826 | 0 |
| B | 0 | 3826 | 0 |
| C | 0 | 3826 | 0 |
| D | 0 | 3826 | 0 |
| Mode M9 | |||
|---|---|---|---|
| Quadrant | BADHDUFLAG | Total packets | Discarded packets |
| A | 0 | 341 | 0 |
| B | 0 | 341 | 0 |
| C | 0 | 341 | 0 |
| D | 0 | 341 | 0 |
| Quadrant | Total seconds | Saturated seconds | Saturation percentage |
|---|---|---|---|
| A | 187737 | 2185 | 1.163862% |
| B | 187737 | 3732 | 1.987887% |
| C | 187737 | 3743 | 1.993747% |
| D | 187737 | 10350 | 5.513032% |
Noise dominated data is calculated using 1-second bins in cleaned event files. If a bin has >2000 counts, and if more than 50% of those come from <1% of pixels, then it is considered to be noise-dominated and hence unusable.
| Quadrant | # 1 sec bins | Bins with >0 counts | Bins with >2000 counts | High rate bins dominated by noise | Noise dominated (total time) | Noise dominated (detector-on time) | Marked lightcurve |
|---|---|---|---|---|---|---|---|
| A | 221047 | 187743 | 31 | 31 | 0.01% | 0.02% |  |
| B | 221048 | 187742 | 39 | 39 | 0.02% | 0.02% |  |
| C | 221047 | 187741 | 50 | 50 | 0.02% | 0.03% |  |
| D | 221047 | 187737 | 1191 | 1191 | 0.54% | 0.63% |  |
Top three noisy pixels from each quadrant. If the there are fewer than three noisy pixels in the level2.evt file, extra rows are filled as -1
| Pixel properties | Quadrant properties | ||||||
|---|---|---|---|---|---|---|---|
| Quadrant | DetID | PixID | Counts | Sigma | Mean | Median | Sigma |
| A | 12 | 16 | 569166 | 250.55 | 10390 | 10219 | 2230.8 |
| A | 5 | 16 | 560059 | 246.47 | 10390 | 10219 | 2230.8 |
| A | 15 | 174 | 199865 | 85.01 | 10390 | 10219 | 2230.8 |
| B | 7 | 220 | 2951841 | 1513.24 | 10430 | 10182 | 1944.0 |
| B | 0 | 189 | 911155 | 463.47 | 10430 | 10182 | 1944.0 |
| B | 0 | 190 | 779452 | 395.72 | 10430 | 10182 | 1944.0 |
| C | 8 | 208 | 3808502 | 1626.21 | 9987 | 9956 | 2335.8 |
| C | 3 | 9 | 1084293 | 459.94 | 9987 | 9956 | 2335.8 |
| C | 9 | 54 | 573114 | 241.1 | 9987 | 9956 | 2335.8 |
| D | 5 | 222 | 18991680 | 8147.46 | 10075 | 9747 | 2329.8 |
| D | 1 | 20 | 9255679 | 3968.56 | 10075 | 9747 | 2329.8 |
| D | 1 | 52 | 3694644 | 1581.64 | 10075 | 9747 | 2329.8 |
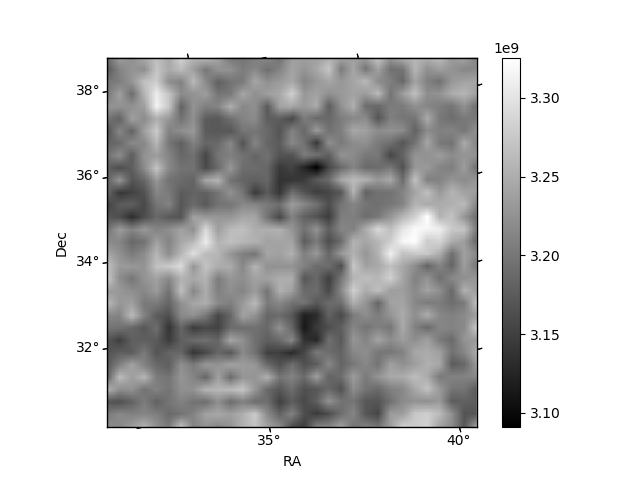
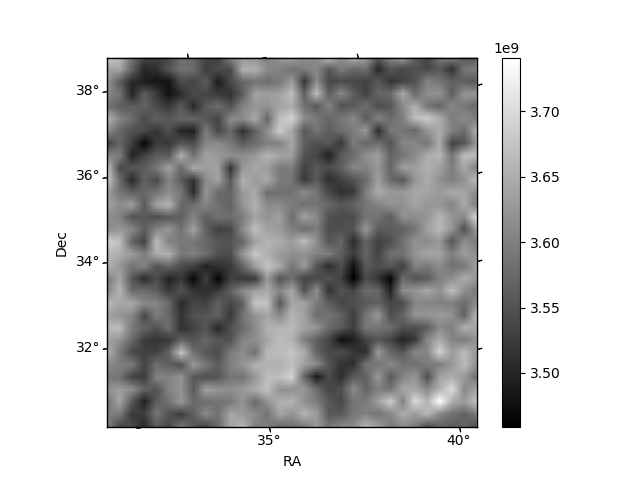
Histogram calculated using DETX and DETY for each event in the final _common_clean file
| Quadrant A |  |
 |
Quadrant B |
|---|---|---|---|
| Quadrant D | 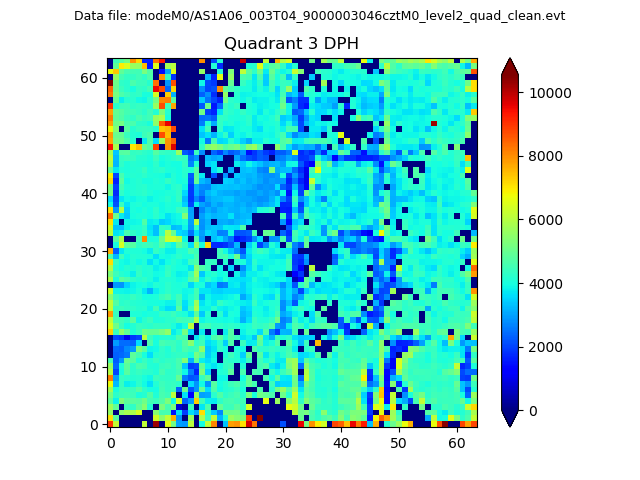 |
 |
Quadrant C |
| Plot type | Count rate plots | Images |
|---|---|---|
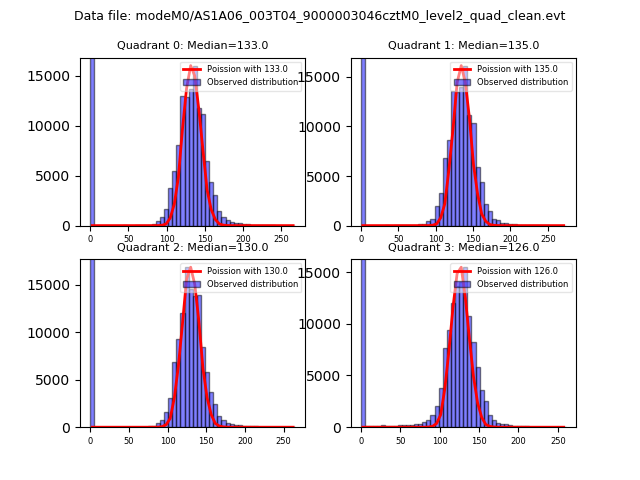
| Comparison with Poisson distribution Blue bars denote a histogram of data divided into 1 sec bins. Red curve is a Poisson curve with rate = median count rate of data. |
 |
 |
| Quadrant-wise count rates Data is divided into 100 sec bins |
 |
|
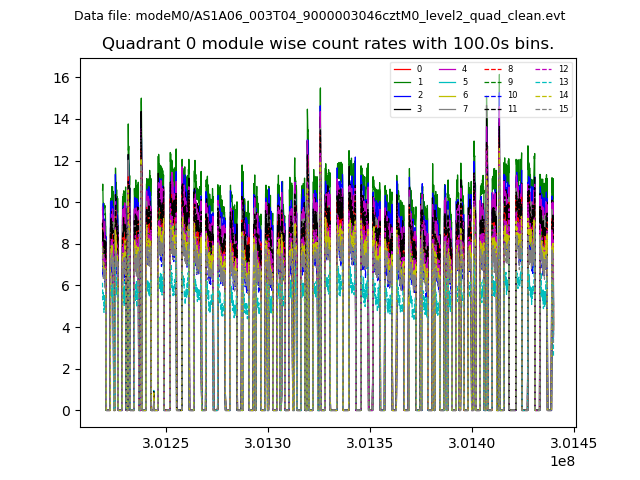
| Module-wise count rates for Quadrant A Data is divided into 100 sec bins |
 |
 |
| Module-wise count rates for Quadrant B Data is divided into 100 sec bins |
 |
 |
| Module-wise count rates for Quadrant C Data is divided into 100 sec bins |
 |
 |
| Module-wise count rates for Quadrant D Data is divided into 100 sec bins |
 |
 |
| Parameter | Plot |
|---|---|
| CZT HV Monitor | 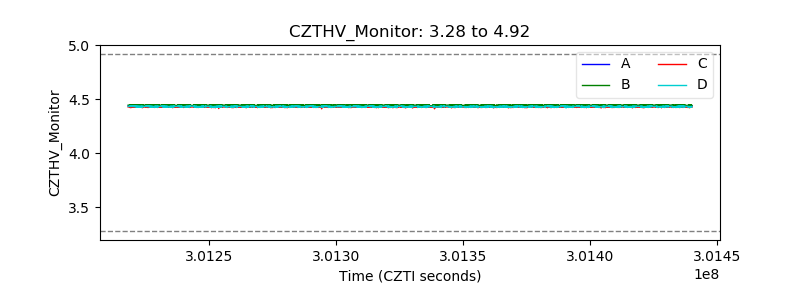 |
| D_VDD | 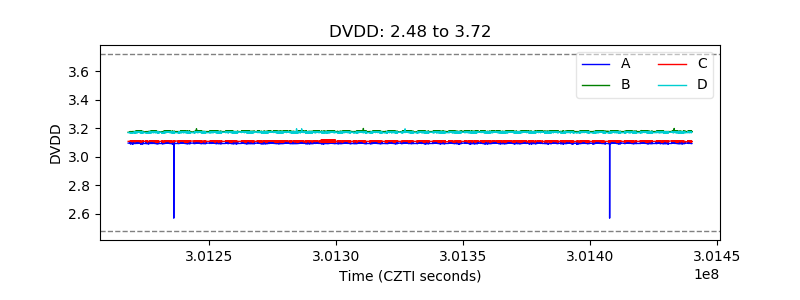 |
| Temperature 1 |  |
| Veto HV Monitor |  |
| Veto LLD | 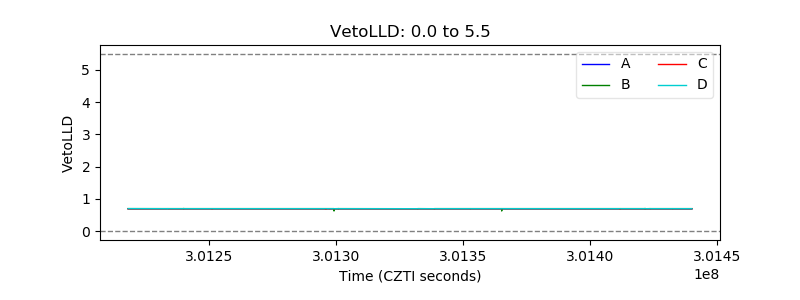 |
| Alpha Counter |  |
| _CPM_Rate |  |
| CZT Counter | 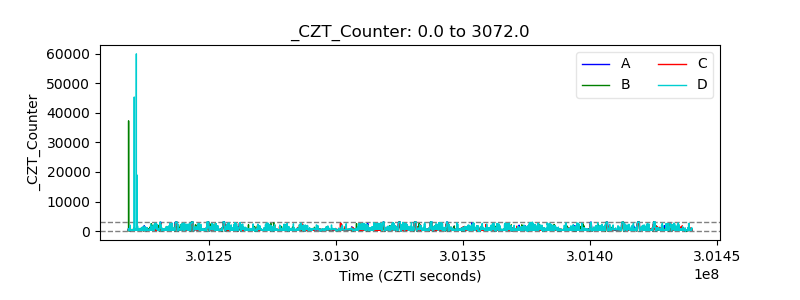 |
| +2.5 Volts monitor |  |
| +5 Volts monitor |  |
| _ROLL_ROT |  |
| _Roll_DEC |  |
| _Roll_RA |  |
| Veto Counter |  |