| Param | Original file | Final file |
|---|---|---|
| Filename | modeM0/AS1A05_088T03_9000003042cztM0_level2_bc.evt | modeM0/AS1A05_088T03_9000003042cztM0_level2_quad_clean.evt |
| Size (bytes) | 1,774,909,440 | 673,905,600 |
| Size | 1.7 GB | 642.7 MB |
| Events in quadrant A | 10,663,034 | 4,365,083 |
| Events in quadrant B | 11,269,775 | 4,364,266 |
| Events in quadrant C | 10,322,582 | 4,249,266 |
| Events in quadrant D | 18,126,990 | 4,042,471 |
| Mode SS | |||
|---|---|---|---|
| Quadrant | BADHDUFLAG | Total packets | Discarded packets |
| A | 0 | 1006 | 0 |
| B | 0 | 1006 | 0 |
| C | 0 | 1006 | 0 |
| D | 0 | 1006 | 0 |
| Mode M9 | |||
|---|---|---|---|
| Quadrant | BADHDUFLAG | Total packets | Discarded packets |
| A | 0 | 91 | 0 |
| B | 0 | 91 | 0 |
| C | 0 | 91 | 0 |
| D | 0 | 91 | 0 |
| Mode M0 | |||
|---|---|---|---|
| Quadrant | BADHDUFLAG | Total packets | Discarded packets |
| A | 0 | 103487 | 0 |
| B | 0 | 105975 | 0 |
| C | 0 | 103501 | 0 |
| D | 0 | 132444 | 0 |
| Quadrant | Total seconds | Saturated seconds | Saturation percentage |
|---|---|---|---|
| A | 49423 | 443 | 0.896344% |
| B | 49423 | 581 | 1.175566% |
| C | 49423 | 656 | 1.327317% |
| D | 49423 | 2464 | 4.985533% |
Noise dominated data is calculated using 1-second bins in cleaned event files. If a bin has >2000 counts, and if more than 50% of those come from <1% of pixels, then it is considered to be noise-dominated and hence unusable.
| Quadrant | # 1 sec bins | Bins with >0 counts | Bins with >2000 counts | High rate bins dominated by noise | Noise dominated (total time) | Noise dominated (detector-on time) | Marked lightcurve |
|---|---|---|---|---|---|---|---|
| A | 58498 | 49424 | 5 | 5 | 0.01% | 0.01% |  |
| B | 58498 | 49425 | 4 | 4 | 0.01% | 0.01% |  |
| C | 58498 | 49425 | 0 | 0 | 0.00% | 0.00% |  |
| D | 58498 | 49420 | 254 | 254 | 0.43% | 0.51% | 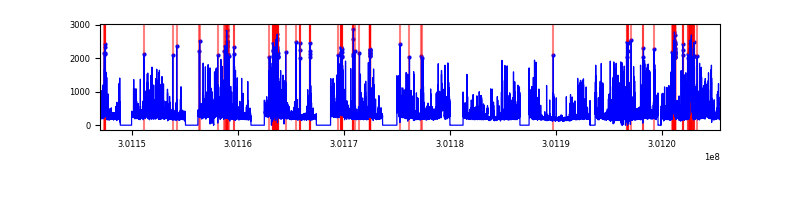 |
Top three noisy pixels from each quadrant. If the there are fewer than three noisy pixels in the level2.evt file, extra rows are filled as -1
| Pixel properties | Quadrant properties | ||||||
|---|---|---|---|---|---|---|---|
| Quadrant | DetID | PixID | Counts | Sigma | Mean | Median | Sigma |
| A | 6 | 16 | 114646 | 191.87 | 2716 | 2669 | 583.6 |
| A | 15 | 174 | 60528 | 99.14 | 2716 | 2669 | 583.6 |
| A | 8 | 205 | 28310 | 43.94 | 2716 | 2669 | 583.6 |
| B | 7 | 220 | 280364 | 549.96 | 2719 | 2655 | 505.0 |
| B | 0 | 219 | 109020 | 210.64 | 2719 | 2655 | 505.0 |
| B | 0 | 197 | 106562 | 205.77 | 2719 | 2655 | 505.0 |
| C | 3 | 9 | 66134 | 102.81 | 2639 | 2631 | 617.7 |
| C | 10 | 91 | 47191 | 72.14 | 2639 | 2631 | 617.7 |
| C | 7 | 220 | 23114 | 33.16 | 2639 | 2631 | 617.7 |
| D | 5 | 222 | 3741437 | 6166.1 | 2629 | 2539 | 606.4 |
| D | 1 | 52 | 2405324 | 3962.61 | 2629 | 2539 | 606.4 |
| D | 1 | 20 | 621430 | 1020.66 | 2629 | 2539 | 606.4 |
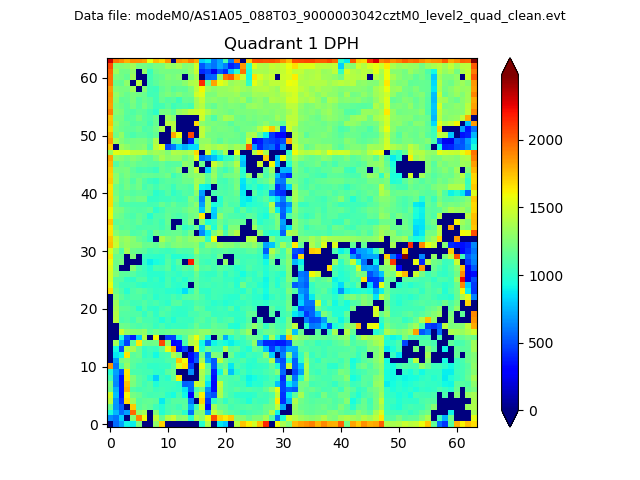
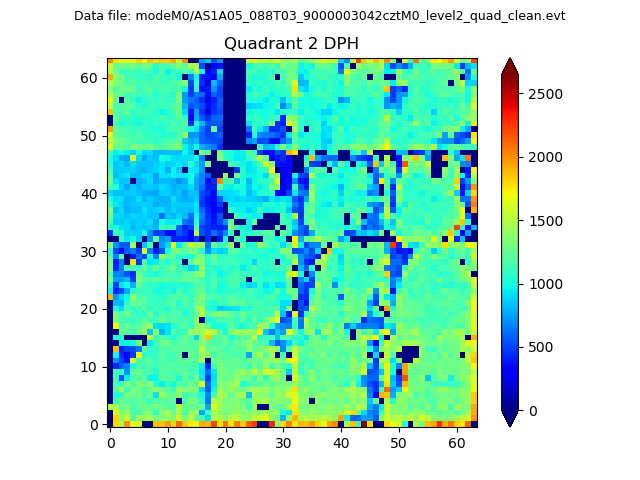
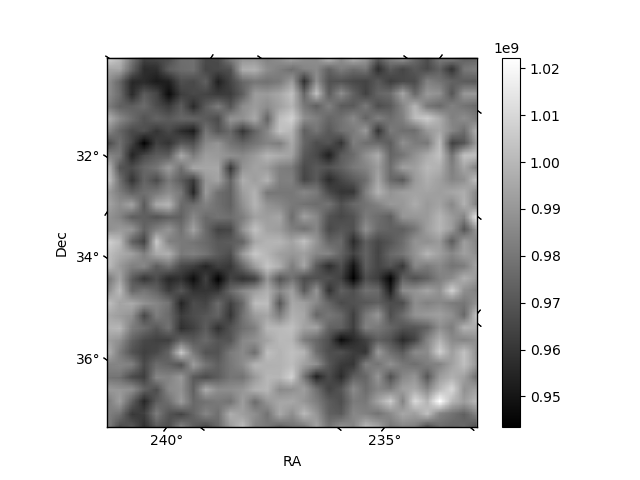
Histogram calculated using DETX and DETY for each event in the final _common_clean file
| Quadrant A |  |
 |
Quadrant B |
|---|---|---|---|
| Quadrant D |  |
 |
Quadrant C |
| Plot type | Count rate plots | Images |
|---|---|---|
| Comparison with Poisson distribution Blue bars denote a histogram of data divided into 1 sec bins. Red curve is a Poisson curve with rate = median count rate of data. |
 |
 |
| Quadrant-wise count rates Data is divided into 100 sec bins |
 |
|
| Module-wise count rates for Quadrant A Data is divided into 100 sec bins |
 |
 |
| Module-wise count rates for Quadrant B Data is divided into 100 sec bins |
 |
 |
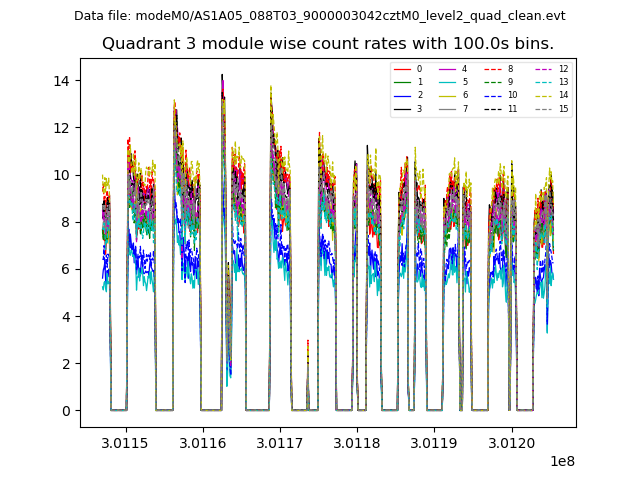
| Module-wise count rates for Quadrant C Data is divided into 100 sec bins |
 |
 |
| Module-wise count rates for Quadrant D Data is divided into 100 sec bins |
 |
 |
| Parameter | Plot |
|---|---|
| CZT HV Monitor | 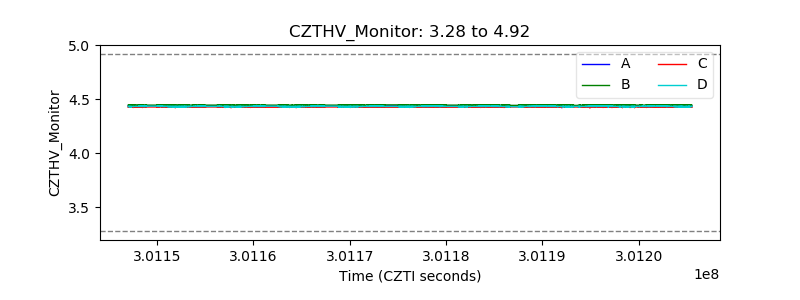 |
| D_VDD | 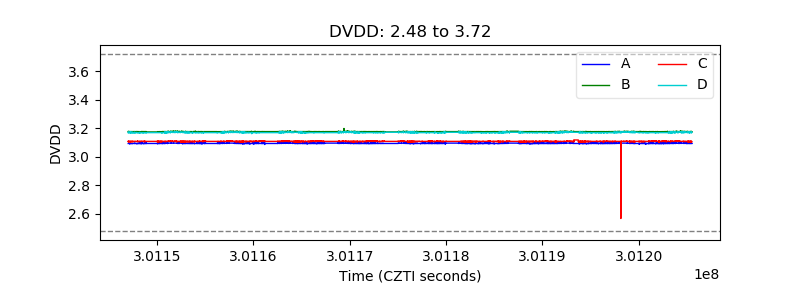 |
| Temperature 1 |  |
| Veto HV Monitor |  |
| Veto LLD |  |
| Alpha Counter |  |
| _CPM_Rate | 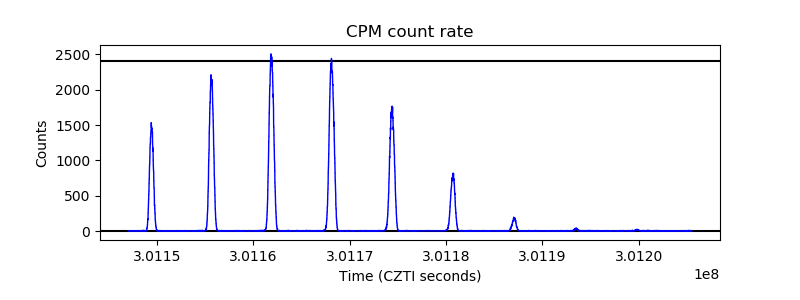 |
| CZT Counter |  |
| +2.5 Volts monitor |  |
| +5 Volts monitor | 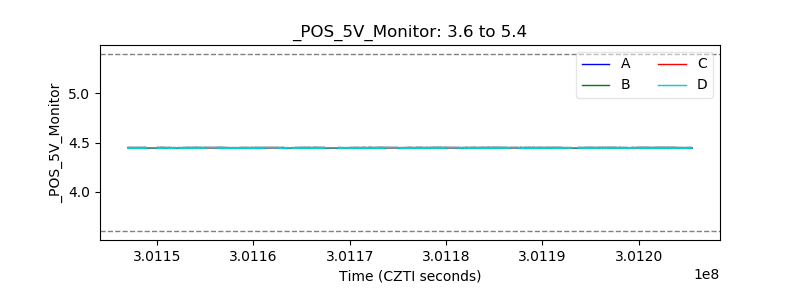 |
| _ROLL_ROT |  |
| _Roll_DEC |  |
| _Roll_RA |  |
| Veto Counter |  |