| Param | Original file | Final file |
|---|---|---|
| Filename | modeM0/AS1A05_072T04_9000003040cztM0_level2_bc.evt | modeM0/AS1A05_072T04_9000003040cztM0_level2_quad_clean.evt |
| Size (bytes) | 2,151,383,040 | 768,421,440 |
| Size | 2.0 GB | 732.8 MB |
| Events in quadrant A | 12,340,121 | 4,884,809 |
| Events in quadrant B | 12,806,562 | 4,927,181 |
| Events in quadrant C | 12,752,434 | 4,813,218 |
| Events in quadrant D | 23,221,356 | 4,589,825 |
| Mode M9 | |||
|---|---|---|---|
| Quadrant | BADHDUFLAG | Total packets | Discarded packets |
| A | 0 | 94 | 0 |
| B | 0 | 94 | 0 |
| C | 0 | 94 | 0 |
| D | 0 | 94 | 0 |
| Mode M0 | |||
|---|---|---|---|
| Quadrant | BADHDUFLAG | Total packets | Discarded packets |
| A | 0 | 122472 | 0 |
| B | 0 | 124087 | 0 |
| C | 0 | 124069 | 0 |
| D | 0 | 156822 | 0 |
| Mode SS | |||
|---|---|---|---|
| Quadrant | BADHDUFLAG | Total packets | Discarded packets |
| A | 0 | 1200 | 0 |
| B | 0 | 1200 | 0 |
| C | 0 | 1200 | 0 |
| D | 0 | 1200 | 0 |
| Quadrant | Total seconds | Saturated seconds | Saturation percentage |
|---|---|---|---|
| A | 59211 | 608 | 1.026836% |
| B | 59211 | 819 | 1.383189% |
| C | 59211 | 922 | 1.557143% |
| D | 59211 | 2518 | 4.252588% |
Noise dominated data is calculated using 1-second bins in cleaned event files. If a bin has >2000 counts, and if more than 50% of those come from <1% of pixels, then it is considered to be noise-dominated and hence unusable.
| Quadrant | # 1 sec bins | Bins with >0 counts | Bins with >2000 counts | High rate bins dominated by noise | Noise dominated (total time) | Noise dominated (detector-on time) | Marked lightcurve |
|---|---|---|---|---|---|---|---|
| A | 68246 | 59213 | 0 | 0 | 0.00% | 0.00% | 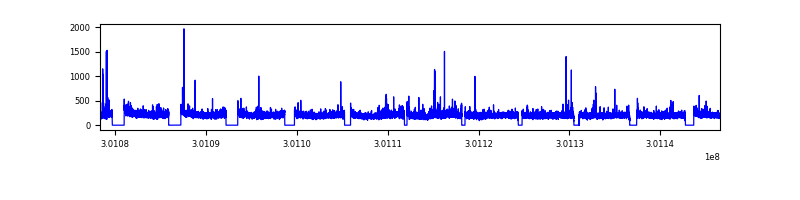 |
| B | 68246 | 59212 | 4 | 4 | 0.01% | 0.01% |  |
| C | 68246 | 59212 | 0 | 0 | 0.00% | 0.00% |  |
| D | 68246 | 59213 | 771 | 771 | 1.13% | 1.30% |  |
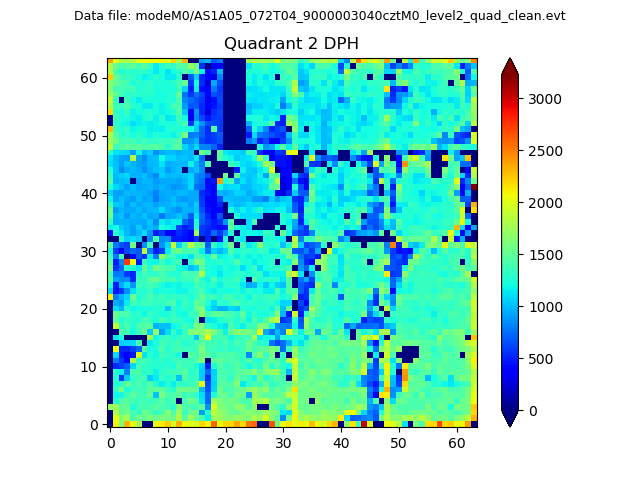
Top three noisy pixels from each quadrant. If the there are fewer than three noisy pixels in the level2.evt file, extra rows are filled as -1
| Pixel properties | Quadrant properties | ||||||
|---|---|---|---|---|---|---|---|
| Quadrant | DetID | PixID | Counts | Sigma | Mean | Median | Sigma |
| A | 14 | 239 | 183291 | 264.8 | 3110 | 3049 | 680.7 |
| A | 8 | 205 | 67807 | 95.14 | 3110 | 3049 | 680.7 |
| A | 12 | 96 | 37690 | 50.89 | 3110 | 3049 | 680.7 |
| B | 7 | 220 | 161764 | 269.52 | 3134 | 3056 | 588.9 |
| B | 0 | 219 | 125156 | 207.35 | 3134 | 3056 | 588.9 |
| B | 3 | 64 | 107653 | 177.63 | 3134 | 3056 | 588.9 |
| C | 3 | 233 | 466955 | 648.22 | 3046 | 3033 | 715.7 |
| C | 3 | 9 | 433300 | 601.2 | 3046 | 3033 | 715.7 |
| C | 8 | 208 | 60434 | 80.2 | 3046 | 3033 | 715.7 |
| D | 1 | 52 | 3241858 | 4591.1 | 3066 | 2965 | 705.5 |
| D | 2 | 16 | 3079477 | 4360.93 | 3066 | 2965 | 705.5 |
| D | 5 | 222 | 1454256 | 2057.19 | 3066 | 2965 | 705.5 |
Histogram calculated using DETX and DETY for each event in the final _common_clean file
| Quadrant A |  |
 |
Quadrant B |
|---|---|---|---|
| Quadrant D |  |
 |
Quadrant C |
| Plot type | Count rate plots | Images |
|---|---|---|
| Comparison with Poisson distribution Blue bars denote a histogram of data divided into 1 sec bins. Red curve is a Poisson curve with rate = median count rate of data. |
 |
 |
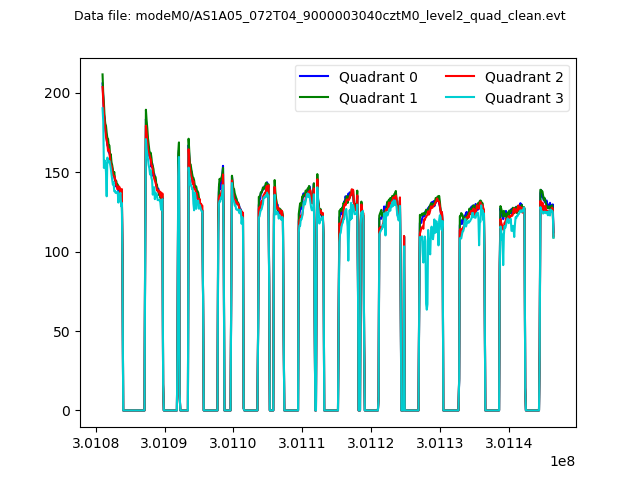
| Quadrant-wise count rates Data is divided into 100 sec bins |
 |
|
| Module-wise count rates for Quadrant A Data is divided into 100 sec bins |
 |
 |
| Module-wise count rates for Quadrant B Data is divided into 100 sec bins |
 |
 |
| Module-wise count rates for Quadrant C Data is divided into 100 sec bins |
 |
 |
| Module-wise count rates for Quadrant D Data is divided into 100 sec bins |
 |
 |
| Parameter | Plot |
|---|---|
| CZT HV Monitor | 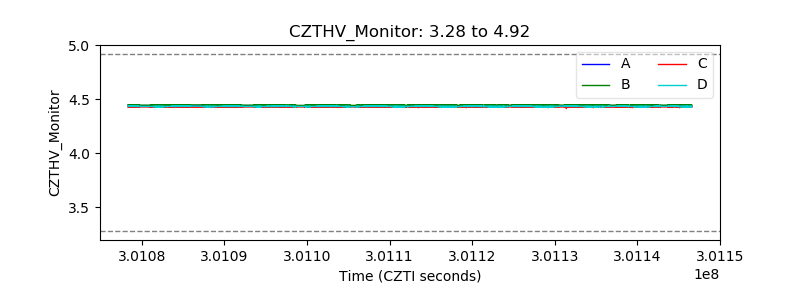 |
| D_VDD | 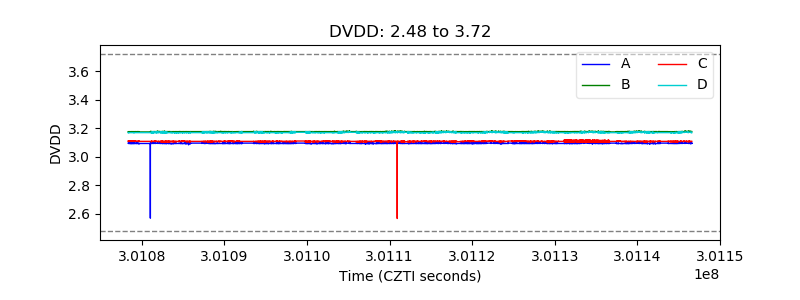 |
| Temperature 1 |  |
| Veto HV Monitor |  |
| Veto LLD |  |
| Alpha Counter |  |
| _CPM_Rate | 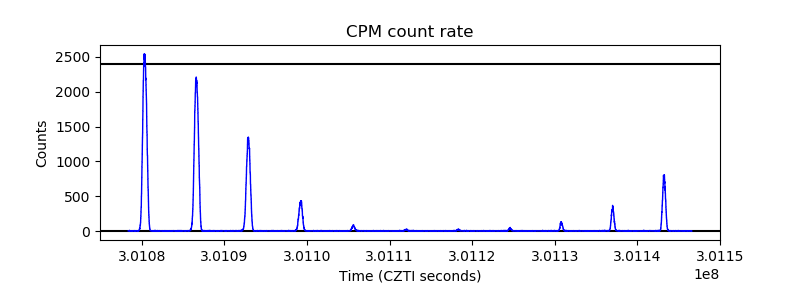 |
| CZT Counter |  |
| +2.5 Volts monitor |  |
| +5 Volts monitor |  |
| _ROLL_ROT | 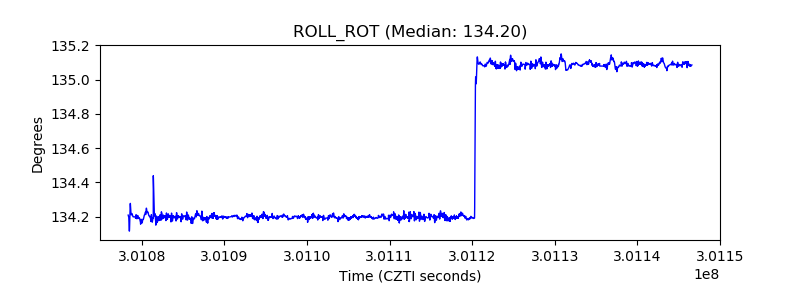 |
| _Roll_DEC |  |
| _Roll_RA | 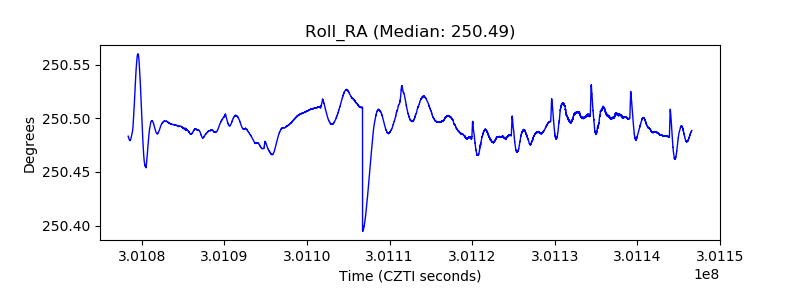 |
| Veto Counter |  |