| Param | Original file | Final file |
|---|---|---|
| Filename | modeM0/AS1A05_069T02_9000003038cztM0_level2_bc.evt | modeM0/AS1A05_069T02_9000003038cztM0_level2_quad_clean.evt |
| Size (bytes) | 1,297,114,560 | 543,041,280 |
| Size | 1.2 GB | 517.9 MB |
| Events in quadrant A | 8,955,576 | 3,480,498 |
| Events in quadrant B | 8,737,792 | 3,546,815 |
| Events in quadrant C | 8,090,612 | 3,348,854 |
| Events in quadrant D | 10,716,721 | 3,274,341 |
| Mode M0 | |||
|---|---|---|---|
| Quadrant | BADHDUFLAG | Total packets | Discarded packets |
| A | 0 | 86312 | 0 |
| B | 0 | 85041 | 0 |
| C | 0 | 84629 | 0 |
| D | 0 | 91962 | 0 |
| Mode M9 | |||
|---|---|---|---|
| Quadrant | BADHDUFLAG | Total packets | Discarded packets |
| A | 0 | 57 | 0 |
| B | 0 | 57 | 0 |
| C | 0 | 57 | 0 |
| D | 0 | 57 | 0 |
| Mode SS | |||
|---|---|---|---|
| Quadrant | BADHDUFLAG | Total packets | Discarded packets |
| A | 0 | 830 | 0 |
| B | 0 | 830 | 0 |
| C | 0 | 830 | 0 |
| D | 0 | 830 | 0 |
| Quadrant | Total seconds | Saturated seconds | Saturation percentage |
|---|---|---|---|
| A | 40749 | 456 | 1.119046% |
| B | 40749 | 473 | 1.160765% |
| C | 40749 | 528 | 1.295737% |
| D | 40749 | 672 | 1.649120% |
Noise dominated data is calculated using 1-second bins in cleaned event files. If a bin has >2000 counts, and if more than 50% of those come from <1% of pixels, then it is considered to be noise-dominated and hence unusable.
| Quadrant | # 1 sec bins | Bins with >0 counts | Bins with >2000 counts | High rate bins dominated by noise | Noise dominated (total time) | Noise dominated (detector-on time) | Marked lightcurve |
|---|---|---|---|---|---|---|---|
| A | 46509 | 40750 | 2 | 2 | 0.00% | 0.00% |  |
| B | 46509 | 40751 | 0 | 0 | 0.00% | 0.00% | 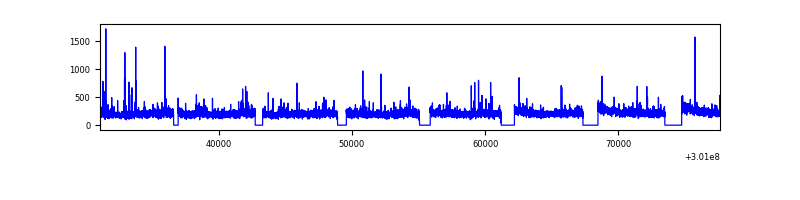 |
| C | 46509 | 40750 | 0 | 0 | 0.00% | 0.00% | 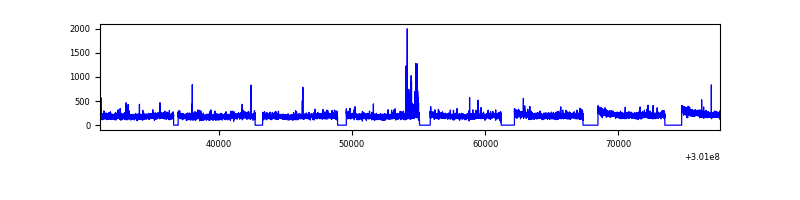 |
| D | 46509 | 40750 | 50 | 50 | 0.11% | 0.12% | 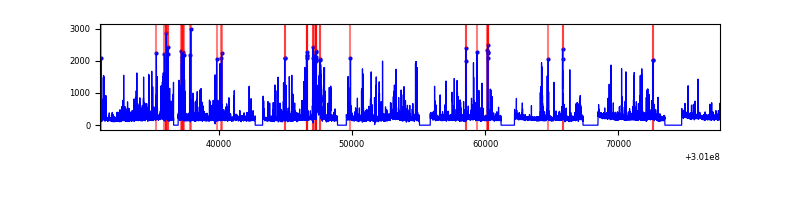 |
Top three noisy pixels from each quadrant. If the there are fewer than three noisy pixels in the level2.evt file, extra rows are filled as -1
| Pixel properties | Quadrant properties | ||||||
|---|---|---|---|---|---|---|---|
| Quadrant | DetID | PixID | Counts | Sigma | Mean | Median | Sigma |
| A | 15 | 174 | 529125 | 1118.98 | 2159 | 2121 | 471.0 |
| A | 14 | 111 | 47978 | 97.37 | 2159 | 2121 | 471.0 |
| A | 8 | 205 | 32520 | 64.54 | 2159 | 2121 | 471.0 |
| B | 0 | 230 | 106537 | 251.21 | 2183 | 2128 | 415.6 |
| B | 0 | 219 | 97330 | 229.06 | 2183 | 2128 | 415.6 |
| B | 0 | 189 | 68786 | 160.38 | 2183 | 2128 | 415.6 |
| C | 8 | 208 | 114220 | 232.31 | 2072 | 2055 | 482.8 |
| C | 13 | 61 | 11877 | 20.34 | 2072 | 2055 | 482.8 |
| C | 3 | 233 | 9598 | 15.62 | 2072 | 2055 | 482.8 |
| D | 1 | 52 | 1494527 | 3086.41 | 2113 | 2040 | 483.6 |
| D | 2 | 165 | 613480 | 1264.44 | 2113 | 2040 | 483.6 |
| D | 13 | 153 | 156056 | 318.5 | 2113 | 2040 | 483.6 |
Histogram calculated using DETX and DETY for each event in the final _common_clean file
| Quadrant A | 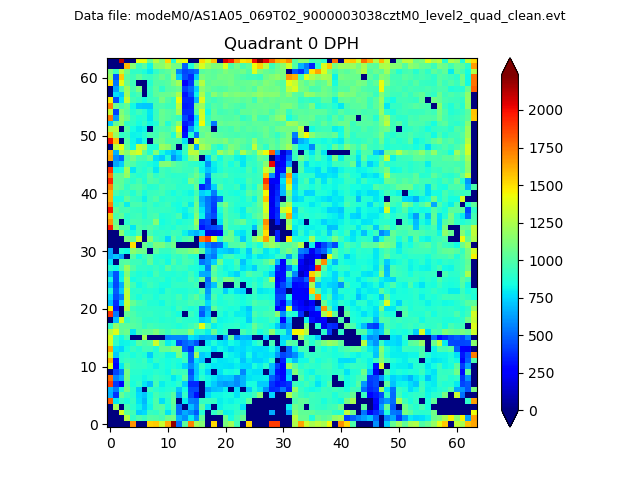 |
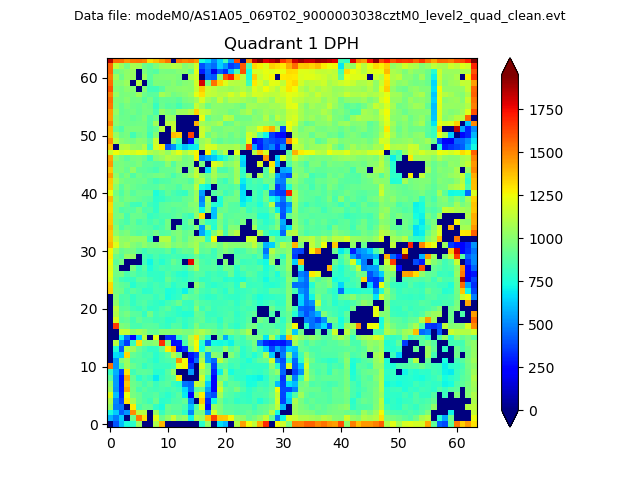 |
Quadrant B |
|---|---|---|---|
| Quadrant D |  |
 |
Quadrant C |
| Plot type | Count rate plots | Images |
|---|---|---|
| Comparison with Poisson distribution Blue bars denote a histogram of data divided into 1 sec bins. Red curve is a Poisson curve with rate = median count rate of data. |
 |
 |
| Quadrant-wise count rates Data is divided into 100 sec bins |
 |
|
| Module-wise count rates for Quadrant A Data is divided into 100 sec bins |
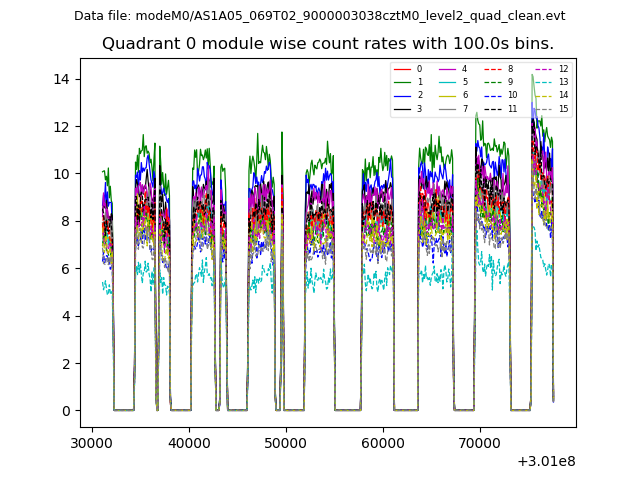 |
 |
| Module-wise count rates for Quadrant B Data is divided into 100 sec bins |
 |
 |
| Module-wise count rates for Quadrant C Data is divided into 100 sec bins |
 |
 |
| Module-wise count rates for Quadrant D Data is divided into 100 sec bins |
 |
 |
| Parameter | Plot |
|---|---|
| CZT HV Monitor | 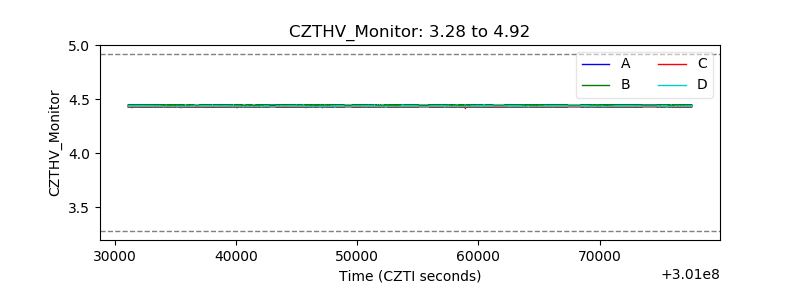 |
| D_VDD |  |
| Temperature 1 |  |
| Veto HV Monitor | 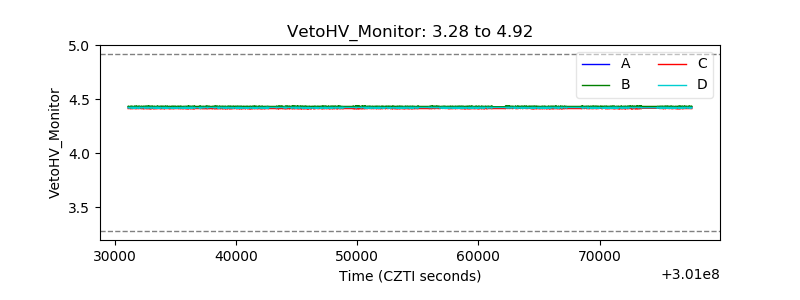 |
| Veto LLD |  |
| Alpha Counter | 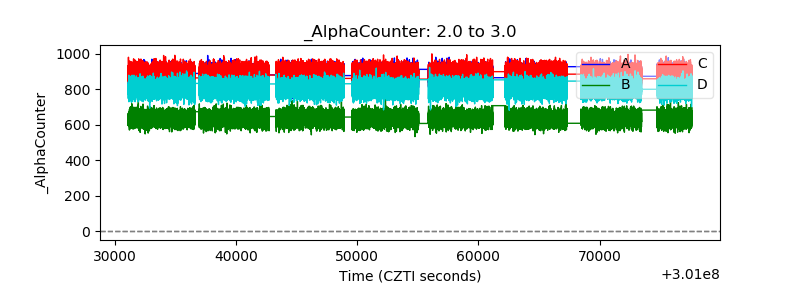 |
| _CPM_Rate |  |
| CZT Counter |  |
| +2.5 Volts monitor |  |
| +5 Volts monitor | 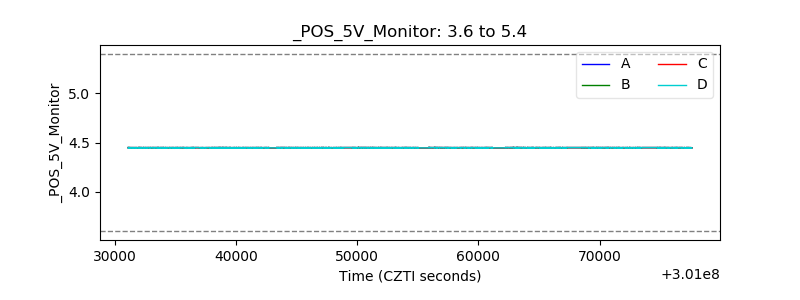 |
| _ROLL_ROT |  |
| _Roll_DEC |  |
| _Roll_RA |  |
| Veto Counter | 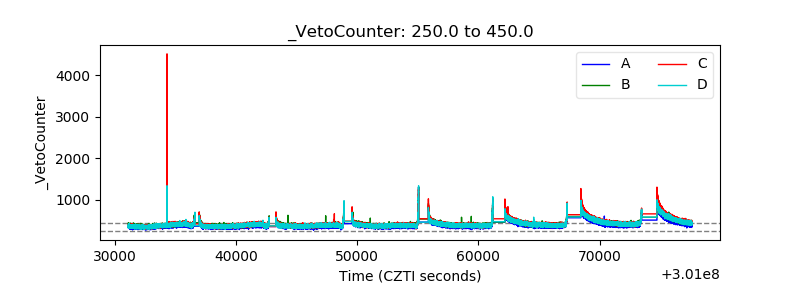 |