| Param | Original file | Final file |
|---|---|---|
| Filename | modeM0/AS1A05_176T04_9000003034cztM0_level2_bc.evt | modeM0/AS1A05_176T04_9000003034cztM0_level2_quad_clean.evt |
| Size (bytes) | 264,913,920 | 98,167,680 |
| Size | 252.6 MB | 93.6 MB |
| Events in quadrant A | 2,434,716 | 654,227 |
| Events in quadrant B | 1,783,592 | 658,367 |
| Events in quadrant C | 1,547,020 | 639,634 |
| Events in quadrant D | 1,863,900 | 623,805 |
| Mode SS | |||
|---|---|---|---|
| Quadrant | BADHDUFLAG | Total packets | Discarded packets |
| A | 0 | 116 | 0 |
| B | 0 | 116 | 0 |
| C | 0 | 116 | 0 |
| D | 0 | 116 | 0 |
| Mode M9 | |||
|---|---|---|---|
| Quadrant | BADHDUFLAG | Total packets | Discarded packets |
| A | 0 | 21 | 0 |
| B | 0 | 21 | 0 |
| C | 0 | 21 | 0 |
| D | 0 | 21 | 0 |
| Mode M0 | |||
|---|---|---|---|
| Quadrant | BADHDUFLAG | Total packets | Discarded packets |
| A | 0 | 15663 | 0 |
| B | 0 | 14597 | 0 |
| C | 0 | 13108 | 0 |
| D | 0 | 13847 | 0 |
| Quadrant | Total seconds | Saturated seconds | Saturation percentage |
|---|---|---|---|
| A | 5673 | 217 | 3.825137% |
| B | 5674 | 140 | 2.467395% |
| C | 5674 | 82 | 1.445189% |
| D | 5674 | 138 | 2.432147% |
Noise dominated data is calculated using 1-second bins in cleaned event files. If a bin has >2000 counts, and if more than 50% of those come from <1% of pixels, then it is considered to be noise-dominated and hence unusable.
| Quadrant | # 1 sec bins | Bins with >0 counts | Bins with >2000 counts | High rate bins dominated by noise | Noise dominated (total time) | Noise dominated (detector-on time) | Marked lightcurve |
|---|---|---|---|---|---|---|---|
| A | 11504 | 5674 | 85 | 85 | 0.74% | 1.50% |  |
| B | 11504 | 5675 | 0 | 0 | 0.00% | 0.00% |  |
| C | 11504 | 5676 | 0 | 0 | 0.00% | 0.00% |  |
| D | 11504 | 5676 | 52 | 52 | 0.45% | 0.92% |  |
Top three noisy pixels from each quadrant. If the there are fewer than three noisy pixels in the level2.evt file, extra rows are filled as -1
| Pixel properties | Quadrant properties | ||||||
|---|---|---|---|---|---|---|---|
| Quadrant | DetID | PixID | Counts | Sigma | Mean | Median | Sigma |
| A | 6 | 16 | 1219120 | 17459.59 | 311 | 305 | 69.8 |
| A | 8 | 205 | 8876 | 122.78 | 311 | 305 | 69.8 |
| A | 11 | 29 | 8480 | 117.11 | 311 | 305 | 69.8 |
| B | 7 | 220 | 206910 | 3412.38 | 311 | 303 | 60.5 |
| B | 0 | 197 | 173718 | 2864.17 | 311 | 303 | 60.5 |
| B | 0 | 189 | 74756 | 1229.69 | 311 | 303 | 60.5 |
| C | 8 | 208 | 178606 | 2447.88 | 300 | 297 | 72.8 |
| C | 9 | 221 | 106311 | 1455.39 | 300 | 297 | 72.8 |
| C | 0 | 207 | 104103 | 1425.08 | 300 | 297 | 72.8 |
| D | 12 | 238 | 302846 | 4174.54 | 307 | 297 | 72.5 |
| D | 13 | 153 | 82544 | 1134.84 | 307 | 297 | 72.5 |
| D | 7 | 38 | 76238 | 1047.83 | 307 | 297 | 72.5 |
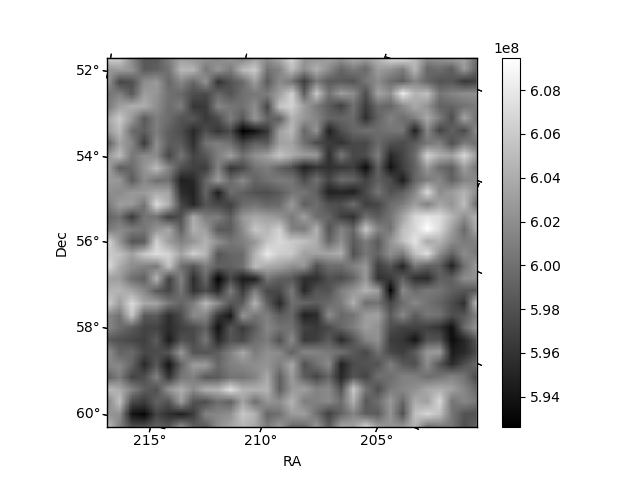
Histogram calculated using DETX and DETY for each event in the final _common_clean file
| Quadrant A |  |
 |
Quadrant B |
|---|---|---|---|
| Quadrant D |  |
 |
Quadrant C |
| Plot type | Count rate plots | Images |
|---|---|---|
| Comparison with Poisson distribution Blue bars denote a histogram of data divided into 1 sec bins. Red curve is a Poisson curve with rate = median count rate of data. |
 |
 |
| Quadrant-wise count rates Data is divided into 100 sec bins |
 |
|
| Module-wise count rates for Quadrant A Data is divided into 100 sec bins |
 |
 |
| Module-wise count rates for Quadrant B Data is divided into 100 sec bins |
 |
 |
| Module-wise count rates for Quadrant C Data is divided into 100 sec bins |
 |
 |
| Module-wise count rates for Quadrant D Data is divided into 100 sec bins |
 |
 |
| Parameter | Plot |
|---|---|
| CZT HV Monitor |  |
| D_VDD |  |
| Temperature 1 |  |
| Veto HV Monitor | 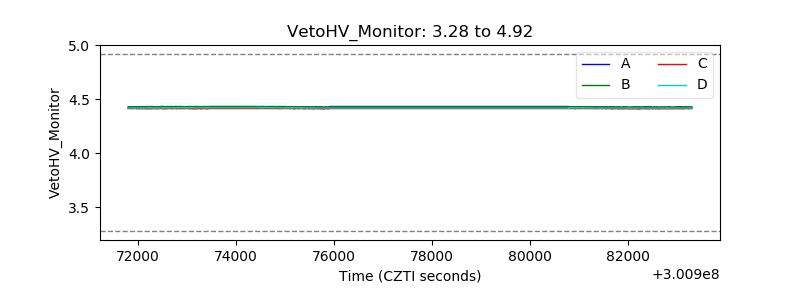 |
| Veto LLD |  |
| Alpha Counter |  |
| _CPM_Rate | 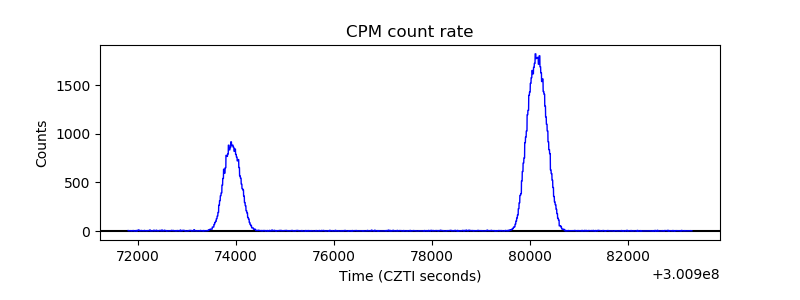 |
| CZT Counter |  |
| +2.5 Volts monitor |  |
| +5 Volts monitor |  |
| _ROLL_ROT | 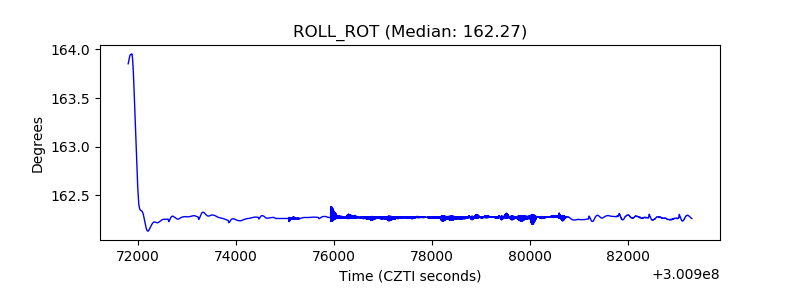 |
| _Roll_DEC |  |
| _Roll_RA |  |
| Veto Counter |  |