| Param | Original file | Final file |
|---|---|---|
| Filename | modeM0/AS1A05_022T08_9000003036cztM0_level2_bc.evt | modeM0/AS1A05_022T08_9000003036cztM0_level2_quad_clean.evt |
| Size (bytes) | 1,376,020,800 | 463,991,040 |
| Size | 1.3 GB | 442.5 MB |
| Events in quadrant A | 9,230,481 | 2,966,236 |
| Events in quadrant B | 9,110,081 | 2,985,324 |
| Events in quadrant C | 8,790,245 | 2,809,762 |
| Events in quadrant D | 11,960,739 | 2,693,999 |
| Mode SS | |||
|---|---|---|---|
| Quadrant | BADHDUFLAG | Total packets | Discarded packets |
| A | 0 | 776 | 0 |
| B | 0 | 776 | 0 |
| C | 0 | 776 | 0 |
| D | 0 | 776 | 0 |
| Mode M0 | |||
|---|---|---|---|
| Quadrant | BADHDUFLAG | Total packets | Discarded packets |
| A | 0 | 82221 | 0 |
| B | 0 | 82735 | 0 |
| C | 0 | 82255 | 0 |
| D | 0 | 92328 | 0 |
| Mode M9 | |||
|---|---|---|---|
| Quadrant | BADHDUFLAG | Total packets | Discarded packets |
| A | 0 | 76 | 0 |
| B | 0 | 76 | 0 |
| C | 0 | 76 | 0 |
| D | 0 | 76 | 0 |
| Quadrant | Total seconds | Saturated seconds | Saturation percentage |
|---|---|---|---|
| A | 37811 | 452 | 1.195419% |
| B | 37811 | 479 | 1.266827% |
| C | 37811 | 543 | 1.436090% |
| D | 37811 | 1079 | 2.853667% |
Noise dominated data is calculated using 1-second bins in cleaned event files. If a bin has >2000 counts, and if more than 50% of those come from <1% of pixels, then it is considered to be noise-dominated and hence unusable.
| Quadrant | # 1 sec bins | Bins with >0 counts | Bins with >2000 counts | High rate bins dominated by noise | Noise dominated (total time) | Noise dominated (detector-on time) | Marked lightcurve |
|---|---|---|---|---|---|---|---|
| A | 45672 | 37813 | 42 | 42 | 0.09% | 0.11% |  |
| B | 45672 | 37813 | 2 | 2 | 0.00% | 0.01% |  |
| C | 45672 | 37812 | 3 | 3 | 0.01% | 0.01% |  |
| D | 45672 | 37812 | 174 | 174 | 0.38% | 0.46% |  |
Top three noisy pixels from each quadrant. If the there are fewer than three noisy pixels in the level2.evt file, extra rows are filled as -1
| Pixel properties | Quadrant properties | ||||||
|---|---|---|---|---|---|---|---|
| Quadrant | DetID | PixID | Counts | Sigma | Mean | Median | Sigma |
| A | 6 | 16 | 1043481 | 2287.18 | 2104 | 2069 | 455.3 |
| A | 14 | 111 | 24644 | 49.58 | 2104 | 2069 | 455.3 |
| A | 8 | 205 | 23735 | 47.58 | 2104 | 2069 | 455.3 |
| B | 7 | 220 | 322732 | 812.91 | 2111 | 2062 | 394.5 |
| B | 0 | 197 | 135859 | 339.18 | 2111 | 2062 | 394.5 |
| B | 0 | 189 | 121271 | 302.2 | 2111 | 2062 | 394.5 |
| C | 9 | 221 | 552826 | 1188.55 | 1985 | 1978 | 463.5 |
| C | 8 | 208 | 501580 | 1077.98 | 1985 | 1978 | 463.5 |
| C | 3 | 233 | 47729 | 98.72 | 1985 | 1978 | 463.5 |
| D | 1 | 52 | 1214211 | 2612.5 | 2003 | 1931 | 464.0 |
| D | 13 | 153 | 924609 | 1988.4 | 2003 | 1931 | 464.0 |
| D | 7 | 38 | 589060 | 1265.28 | 2003 | 1931 | 464.0 |
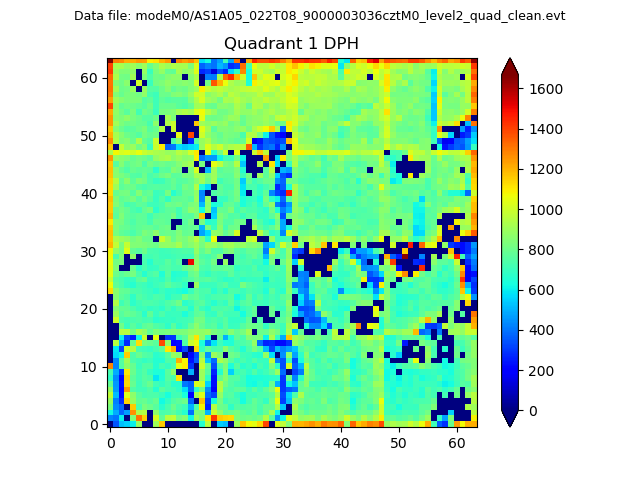
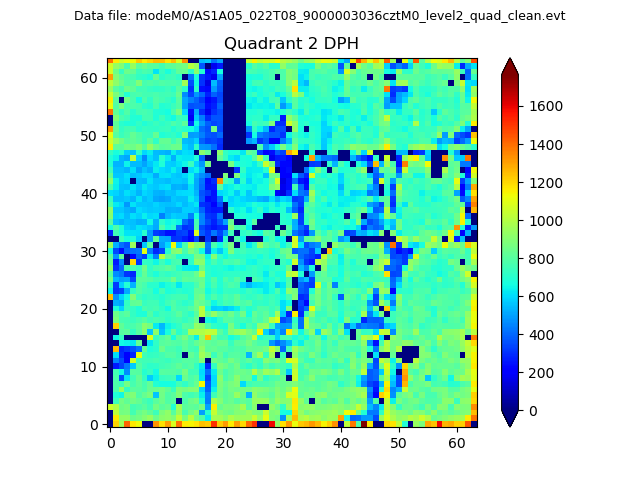
Histogram calculated using DETX and DETY for each event in the final _common_clean file
| Quadrant A |  |
 |
Quadrant B |
|---|---|---|---|
| Quadrant D |  |
 |
Quadrant C |
| Plot type | Count rate plots | Images |
|---|---|---|
| Comparison with Poisson distribution Blue bars denote a histogram of data divided into 1 sec bins. Red curve is a Poisson curve with rate = median count rate of data. |
 |
 |
| Quadrant-wise count rates Data is divided into 100 sec bins |
 |
|
| Module-wise count rates for Quadrant A Data is divided into 100 sec bins |
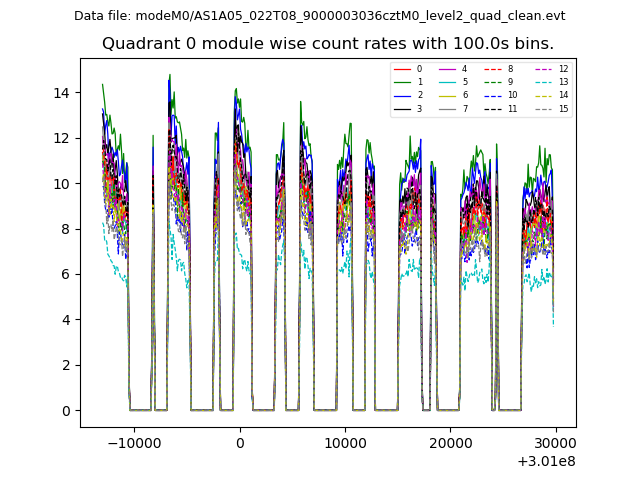 |
 |
| Module-wise count rates for Quadrant B Data is divided into 100 sec bins |
 |
 |
| Module-wise count rates for Quadrant C Data is divided into 100 sec bins |
 |
 |
| Module-wise count rates for Quadrant D Data is divided into 100 sec bins |
 |
 |
| Parameter | Plot |
|---|---|
| CZT HV Monitor |  |
| D_VDD | 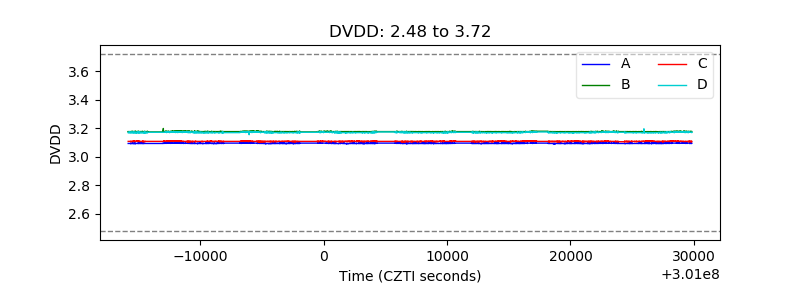 |
| Temperature 1 |  |
| Veto HV Monitor |  |
| Veto LLD |  |
| Alpha Counter |  |
| _CPM_Rate |  |
| CZT Counter |  |
| +2.5 Volts monitor | 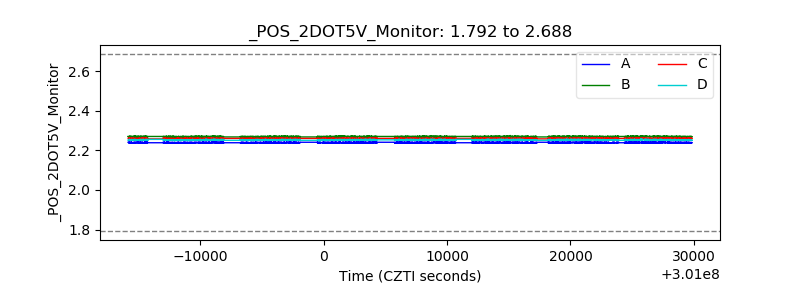 |
| +5 Volts monitor |  |
| _ROLL_ROT |  |
| _Roll_DEC |  |
| _Roll_RA |  |
| Veto Counter |  |