| Param | Original file | Final file |
|---|---|---|
| Filename | modeM0/AS1A05_115T03_9000003032cztM0_level2_bc.evt | modeM0/AS1A05_115T03_9000003032cztM0_level2_quad_clean.evt |
| Size (bytes) | 4,637,972,160 | 1,427,817,600 |
| Size | 4.3 GB | 1.3 GB |
| Events in quadrant A | 26,487,975 | 9,213,529 |
| Events in quadrant B | 28,555,352 | 9,289,295 |
| Events in quadrant C | 22,465,741 | 8,879,308 |
| Events in quadrant D | 55,214,127 | 8,074,658 |
| Mode M9 | |||
|---|---|---|---|
| Quadrant | BADHDUFLAG | Total packets | Discarded packets |
| A | 0 | 158 | 0 |
| B | 0 | 159 | 0 |
| C | 0 | 159 | 0 |
| D | 0 | 159 | 0 |
| Mode M0 | |||
|---|---|---|---|
| Quadrant | BADHDUFLAG | Total packets | Discarded packets |
| A | 0 | 246154 | 0 |
| B | 0 | 254903 | 0 |
| C | 0 | 234936 | 0 |
| D | 0 | 354048 | 0 |
| Mode SS | |||
|---|---|---|---|
| Quadrant | BADHDUFLAG | Total packets | Discarded packets |
| A | 0 | 2310 | 0 |
| B | 0 | 2310 | 0 |
| C | 0 | 2310 | 0 |
| D | 0 | 2310 | 0 |
| Quadrant | Total seconds | Saturated seconds | Saturation percentage |
|---|---|---|---|
| A | 113654 | 2421 | 2.130149% |
| B | 113654 | 2499 | 2.198779% |
| C | 113654 | 1974 | 1.736850% |
| D | 113653 | 11695 | 10.290094% |
Noise dominated data is calculated using 1-second bins in cleaned event files. If a bin has >2000 counts, and if more than 50% of those come from <1% of pixels, then it is considered to be noise-dominated and hence unusable.
| Quadrant | # 1 sec bins | Bins with >0 counts | Bins with >2000 counts | High rate bins dominated by noise | Noise dominated (total time) | Noise dominated (detector-on time) | Marked lightcurve |
|---|---|---|---|---|---|---|---|
| A | 133712 | 113641 | 121 | 121 | 0.09% | 0.11% |  |
| B | 133712 | 113641 | 19 | 19 | 0.01% | 0.02% | 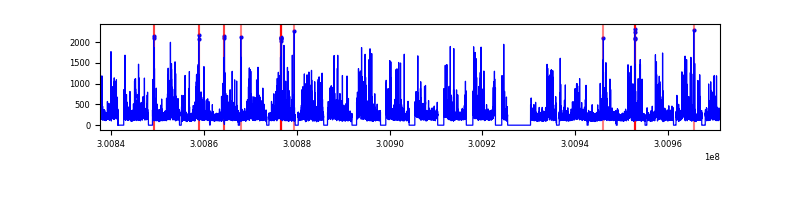 |
| C | 133712 | 113645 | 5 | 5 | 0.00% | 0.00% | 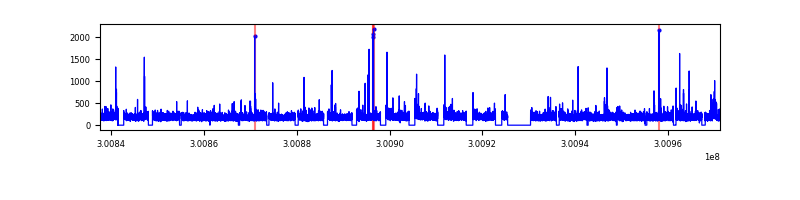 |
| D | 133712 | 113633 | 2678 | 2678 | 2.00% | 2.36% |  |
Top three noisy pixels from each quadrant. If the there are fewer than three noisy pixels in the level2.evt file, extra rows are filled as -1
| Pixel properties | Quadrant properties | ||||||
|---|---|---|---|---|---|---|---|
| Quadrant | DetID | PixID | Counts | Sigma | Mean | Median | Sigma |
| A | 5 | 16 | 1511152 | 1161.39 | 5905 | 5789 | 1296.2 |
| A | 6 | 16 | 1141186 | 875.96 | 5905 | 5789 | 1296.2 |
| A | 14 | 254 | 576503 | 440.31 | 5905 | 5789 | 1296.2 |
| B | 7 | 220 | 1463130 | 1291.97 | 5973 | 5826 | 1128.0 |
| B | 0 | 189 | 1328822 | 1172.9 | 5973 | 5826 | 1128.0 |
| B | 0 | 197 | 625998 | 549.81 | 5973 | 5826 | 1128.0 |
| C | 8 | 208 | 190155 | 137.33 | 5695 | 5667 | 1343.4 |
| C | 0 | 207 | 93901 | 65.68 | 5695 | 5667 | 1343.4 |
| C | 3 | 233 | 75776 | 52.19 | 5695 | 5667 | 1343.4 |
| D | 1 | 52 | 9458345 | 7235.88 | 5529 | 5319 | 1306.4 |
| D | 12 | 238 | 7046535 | 5389.74 | 5529 | 5319 | 1306.4 |
| D | 5 | 222 | 5069291 | 3876.25 | 5529 | 5319 | 1306.4 |
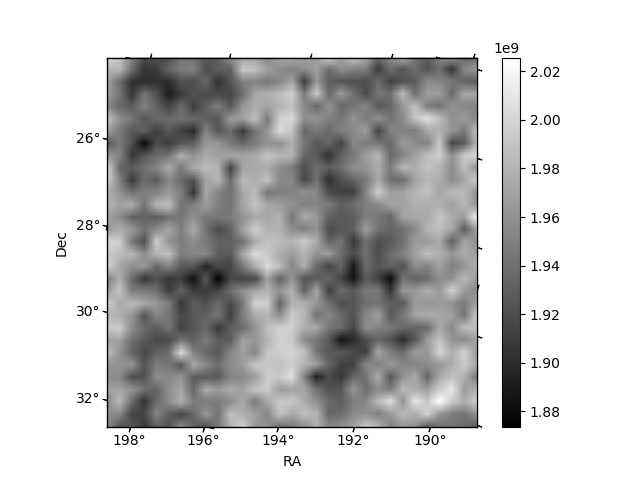
Histogram calculated using DETX and DETY for each event in the final _common_clean file
| Quadrant A | 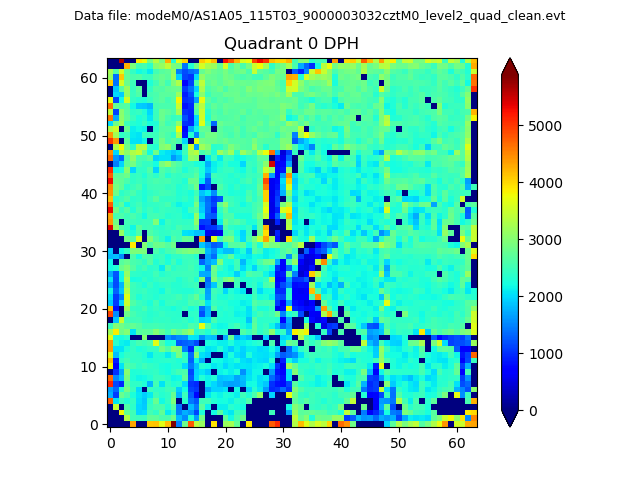 |
 |
Quadrant B |
|---|---|---|---|
| Quadrant D |  |
 |
Quadrant C |
| Plot type | Count rate plots | Images |
|---|---|---|
| Comparison with Poisson distribution Blue bars denote a histogram of data divided into 1 sec bins. Red curve is a Poisson curve with rate = median count rate of data. |
 |
 |
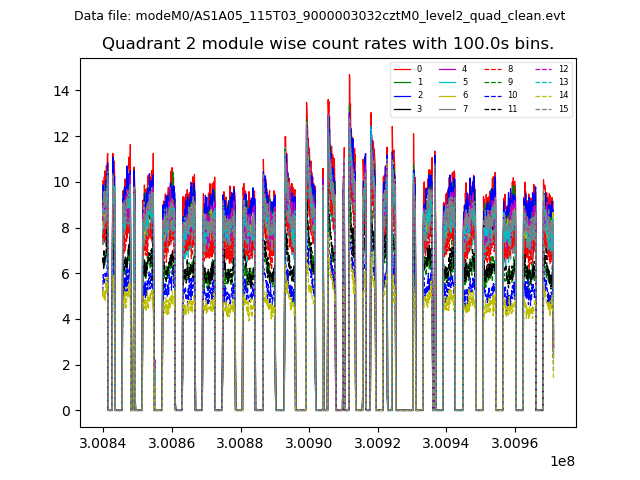
| Quadrant-wise count rates Data is divided into 100 sec bins |
 |
|
| Module-wise count rates for Quadrant A Data is divided into 100 sec bins |
 |
 |
| Module-wise count rates for Quadrant B Data is divided into 100 sec bins |
 |
 |
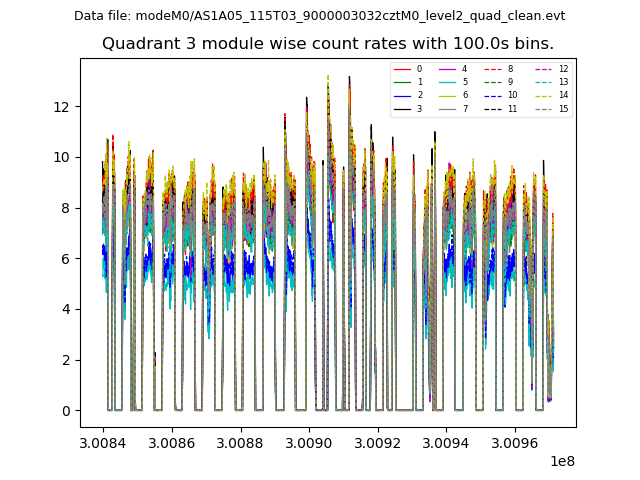
| Module-wise count rates for Quadrant C Data is divided into 100 sec bins |
 |
 |
| Module-wise count rates for Quadrant D Data is divided into 100 sec bins |
 |
 |
| Parameter | Plot |
|---|---|
| CZT HV Monitor |  |
| D_VDD |  |
| Temperature 1 |  |
| Veto HV Monitor |  |
| Veto LLD |  |
| Alpha Counter | 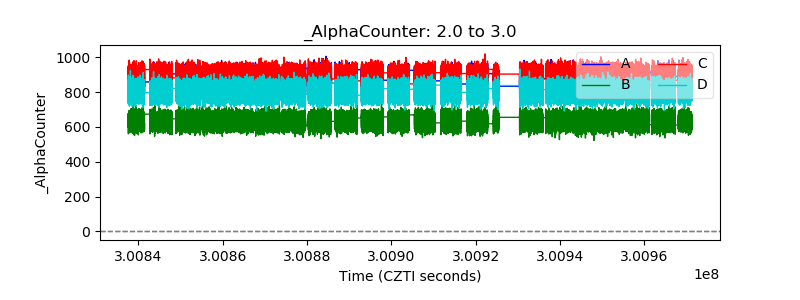 |
| _CPM_Rate |  |
| CZT Counter | 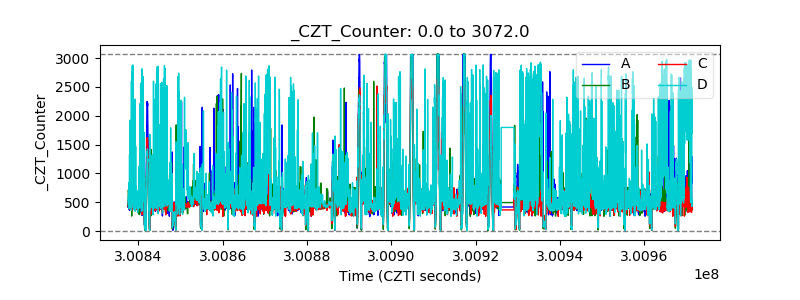 |
| +2.5 Volts monitor | 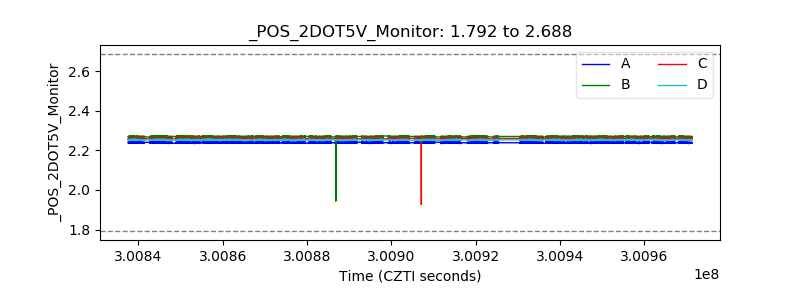 |
| +5 Volts monitor |  |
| _ROLL_ROT |  |
| _Roll_DEC |  |
| _Roll_RA |  |
| Veto Counter |  |