| Param | Original file | Final file |
|---|---|---|
| Filename | modeM0/AS1A05_176T03_9000003028cztM0_level2.evt | modeM0/AS1A05_176T03_9000003028cztM0_level2_quad_clean.evt |
| Size (bytes) | 1,347,333,120 | 188,055,360 |
| Size | 1.3 GB | 179.3 MB |
| Events in quadrant A | 7,030,333 | 1,226,265 |
| Events in quadrant B | 8,368,873 | 1,219,062 |
| Events in quadrant C | 7,100,310 | 1,181,860 |
| Events in quadrant D | 17,309,711 | 1,050,024 |
| Mode M0 | |||
|---|---|---|---|
| Quadrant | BADHDUFLAG | Total packets | Discarded packets |
| A | 0 | 30697 | 0 |
| B | 0 | 34308 | 0 |
| C | 0 | 30352 | 0 |
| D | 0 | 61636 | 0 |
| Mode SS | |||
|---|---|---|---|
| Quadrant | BADHDUFLAG | Total packets | Discarded packets |
| A | 0 | 298 | 0 |
| B | 0 | 298 | 0 |
| C | 0 | 298 | 0 |
| D | 0 | 298 | 0 |
| Mode M9 | |||
|---|---|---|---|
| Quadrant | BADHDUFLAG | Total packets | Discarded packets |
| A | 0 | 20 | 0 |
| B | 0 | 20 | 0 |
| C | 0 | 20 | 0 |
| D | 0 | 20 | 0 |
| Quadrant | Total seconds | Saturated seconds | Saturation percentage |
|---|---|---|---|
| A | 14754 | 270 | 1.830012% |
| B | 14754 | 389 | 2.636573% |
| C | 14754 | 270 | 1.830012% |
| D | 14754 | 3344 | 22.665040% |
Noise dominated data is calculated using 1-second bins in cleaned event files. If a bin has >2000 counts, and if more than 50% of those come from <1% of pixels, then it is considered to be noise-dominated and hence unusable.
| Quadrant | # 1 sec bins | Bins with >0 counts | Bins with >2000 counts | High rate bins dominated by noise | Noise dominated (total time) | Noise dominated (detector-on time) | Marked lightcurve |
|---|---|---|---|---|---|---|---|
| A | 16654 | 14754 | 33 | 33 | 0.20% | 0.22% |  |
| B | 16654 | 14754 | 134 | 134 | 0.80% | 0.91% |  |
| C | 16654 | 14754 | 3 | 3 | 0.02% | 0.02% |  |
| D | 16653 | 14753 | 2986 | 2986 | 17.93% | 20.24% |  |
Top three noisy pixels from each quadrant. If the there are fewer than three noisy pixels in the level2.evt file, extra rows are filled as -1
| Pixel properties | Quadrant properties | ||||||
|---|---|---|---|---|---|---|---|
| Quadrant | DetID | PixID | Counts | Sigma | Mean | Median | Sigma |
| A | 5 | 16 | 128929 | 350.99 | 1772 | 1728 | 362.4 |
| A | 12 | 96 | 48581 | 129.28 | 1772 | 1728 | 362.4 |
| A | 9 | 143 | 23706 | 60.64 | 1772 | 1728 | 362.4 |
| B | 7 | 220 | 490989 | 1454.17 | 1762 | 1716 | 336.5 |
| B | 0 | 189 | 266126 | 785.85 | 1762 | 1716 | 336.5 |
| B | 0 | 197 | 236994 | 699.27 | 1762 | 1716 | 336.5 |
| C | 14 | 238 | 262923 | 654.59 | 1702 | 1708 | 399.0 |
| C | 3 | 233 | 152206 | 377.14 | 1702 | 1708 | 399.0 |
| C | 0 | 207 | 35691 | 85.16 | 1702 | 1708 | 399.0 |
| D | 7 | 238 | 3506490 | 9101.93 | 1572 | 1524 | 385.1 |
| D | 1 | 52 | 2510769 | 6516.17 | 1572 | 1524 | 385.1 |
| D | 5 | 222 | 2296485 | 5959.71 | 1572 | 1524 | 385.1 |
Histogram calculated using DETX and DETY for each event in the final _common_clean file
| Quadrant A |  |
 |
Quadrant B |
|---|---|---|---|
| Quadrant D |  |
 |
Quadrant C |
| Plot type | Count rate plots | Images |
|---|---|---|
| Comparison with Poisson distribution Blue bars denote a histogram of data divided into 1 sec bins. Red curve is a Poisson curve with rate = median count rate of data. |
 |
 |
| Quadrant-wise count rates Data is divided into 100 sec bins |
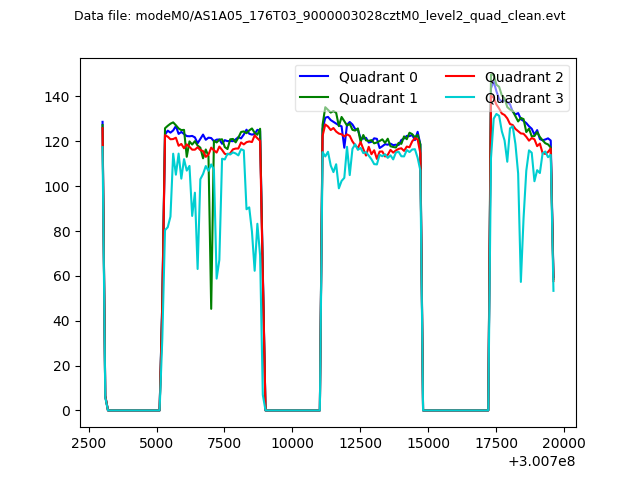 |
|
| Module-wise count rates for Quadrant A Data is divided into 100 sec bins |
 |
 |
| Module-wise count rates for Quadrant B Data is divided into 100 sec bins |
 |
 |
| Module-wise count rates for Quadrant C Data is divided into 100 sec bins |
 |
 |
| Module-wise count rates for Quadrant D Data is divided into 100 sec bins |
 |
 |
| Parameter | Plot |
|---|---|
| CZT HV Monitor |  |
| D_VDD | 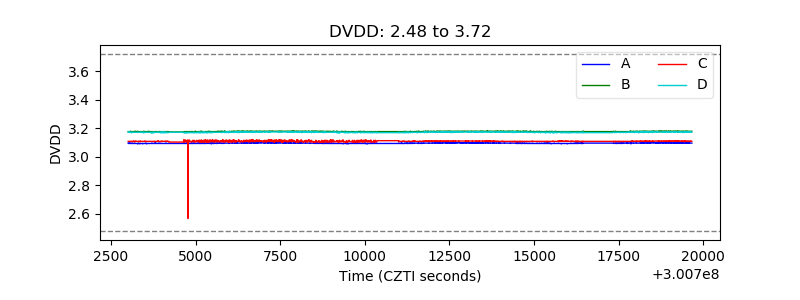 |
| Temperature 1 | 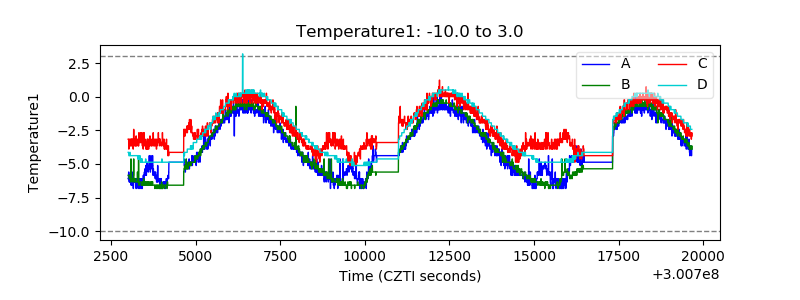 |
| Veto HV Monitor |  |
| Veto LLD |  |
| Alpha Counter |  |
| _CPM_Rate |  |
| CZT Counter |  |
| +2.5 Volts monitor |  |
| +5 Volts monitor |  |
| _ROLL_ROT |  |
| _Roll_DEC |  |
| _Roll_RA | 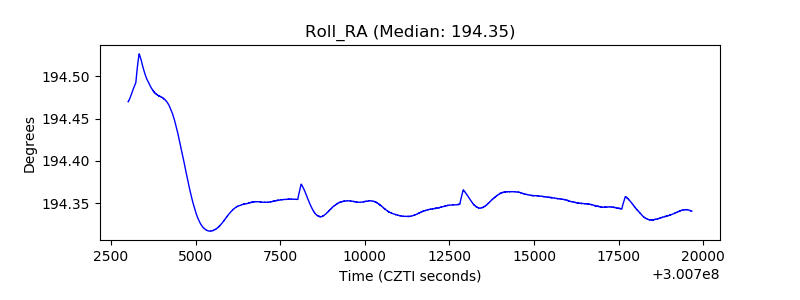 |
| Veto Counter |  |