| Param | Original file | Final file |
|---|---|---|
| Filename | modeM0/AS1A05_115T01_9000003030cztM0_level2_bc.evt | modeM0/AS1A05_115T01_9000003030cztM0_level2_quad_clean.evt |
| Size (bytes) | 4,879,664,640 | 1,222,758,720 |
| Size | 4.5 GB | 1.1 GB |
| Events in quadrant A | 22,032,437 | 7,989,172 |
| Events in quadrant B | 25,230,992 | 8,064,757 |
| Events in quadrant C | 20,878,628 | 7,666,964 |
| Events in quadrant D | 72,934,123 | 6,552,512 |
| Mode M9 | |||
|---|---|---|---|
| Quadrant | BADHDUFLAG | Total packets | Discarded packets |
| A | 0 | 188 | 0 |
| B | 0 | 188 | 0 |
| C | 0 | 188 | 0 |
| D | 0 | 188 | 0 |
| Mode SS | |||
|---|---|---|---|
| Quadrant | BADHDUFLAG | Total packets | Discarded packets |
| A | 0 | 2004 | 0 |
| B | 0 | 2004 | 0 |
| C | 0 | 2004 | 0 |
| D | 0 | 2004 | 0 |
| Mode M0 | |||
|---|---|---|---|
| Quadrant | BADHDUFLAG | Total packets | Discarded packets |
| A | 0 | 208911 | 0 |
| B | 0 | 220722 | 0 |
| C | 0 | 207766 | 0 |
| D | 0 | 381421 | 0 |
| Quadrant | Total seconds | Saturated seconds | Saturation percentage |
|---|---|---|---|
| A | 98609 | 1376 | 1.395410% |
| B | 98613 | 1815 | 1.840528% |
| C | 98610 | 1560 | 1.581990% |
| D | 98607 | 17005 | 17.245226% |
Noise dominated data is calculated using 1-second bins in cleaned event files. If a bin has >2000 counts, and if more than 50% of those come from <1% of pixels, then it is considered to be noise-dominated and hence unusable.
| Quadrant | # 1 sec bins | Bins with >0 counts | Bins with >2000 counts | High rate bins dominated by noise | Noise dominated (total time) | Noise dominated (detector-on time) | Marked lightcurve |
|---|---|---|---|---|---|---|---|
| A | 117229 | 98603 | 39 | 39 | 0.03% | 0.04% | 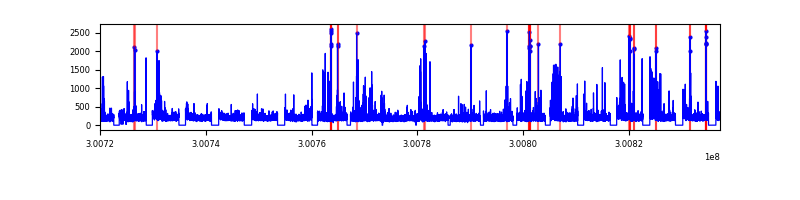 |
| B | 117229 | 98602 | 11 | 11 | 0.01% | 0.01% |  |
| C | 117229 | 98604 | 0 | 0 | 0.00% | 0.00% | 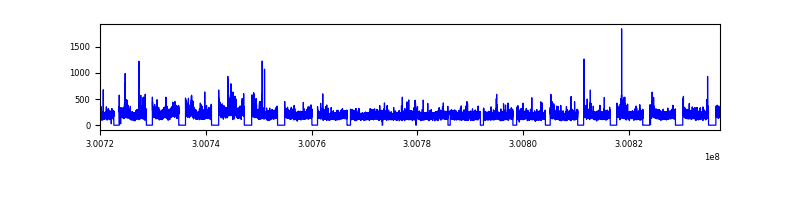 |
| D | 117229 | 98594 | 7618 | 7618 | 6.50% | 7.73% |  |
Top three noisy pixels from each quadrant. If the there are fewer than three noisy pixels in the level2.evt file, extra rows are filled as -1
| Pixel properties | Quadrant properties | ||||||
|---|---|---|---|---|---|---|---|
| Quadrant | DetID | PixID | Counts | Sigma | Mean | Median | Sigma |
| A | 5 | 16 | 987346 | 852.51 | 5299 | 5207 | 1152.1 |
| A | 12 | 96 | 570288 | 490.5 | 5299 | 5207 | 1152.1 |
| A | 13 | 254 | 94635 | 77.62 | 5299 | 5207 | 1152.1 |
| B | 0 | 189 | 1276538 | 1270.77 | 5366 | 5247 | 1000.4 |
| B | 0 | 197 | 985337 | 979.68 | 5366 | 5247 | 1000.4 |
| B | 7 | 220 | 525867 | 520.4 | 5366 | 5247 | 1000.4 |
| C | 3 | 233 | 1030163 | 852.69 | 5105 | 5080 | 1202.2 |
| C | 3 | 9 | 51185 | 38.35 | 5105 | 5080 | 1202.2 |
| C | 0 | 207 | 39886 | 28.95 | 5105 | 5080 | 1202.2 |
| D | 2 | 16 | 27005279 | 23195.27 | 4839 | 4659 | 1164.1 |
| D | 1 | 52 | 7924720 | 6803.84 | 4839 | 4659 | 1164.1 |
| D | 7 | 38 | 7071927 | 6071.24 | 4839 | 4659 | 1164.1 |
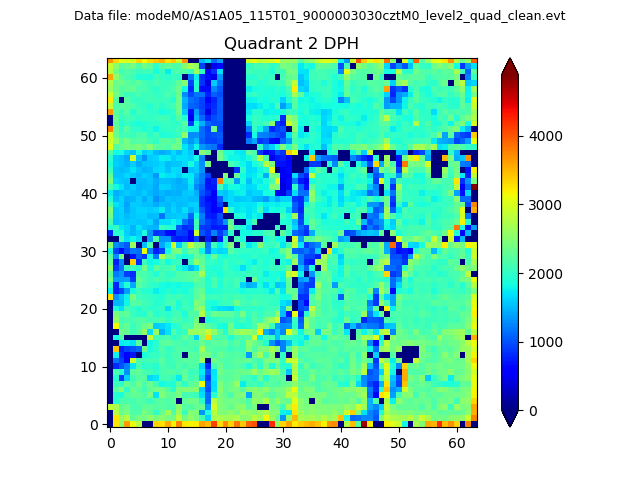
Histogram calculated using DETX and DETY for each event in the final _common_clean file
| Quadrant A |  |
 |
Quadrant B |
|---|---|---|---|
| Quadrant D | 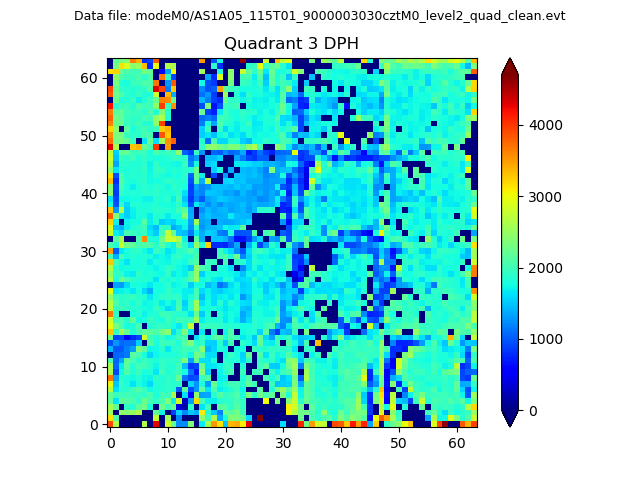 |
 |
Quadrant C |
| Plot type | Count rate plots | Images |
|---|---|---|
| Comparison with Poisson distribution Blue bars denote a histogram of data divided into 1 sec bins. Red curve is a Poisson curve with rate = median count rate of data. |
 |
 |
| Quadrant-wise count rates Data is divided into 100 sec bins |
 |
|
| Module-wise count rates for Quadrant A Data is divided into 100 sec bins |
 |
 |
| Module-wise count rates for Quadrant B Data is divided into 100 sec bins |
 |
 |
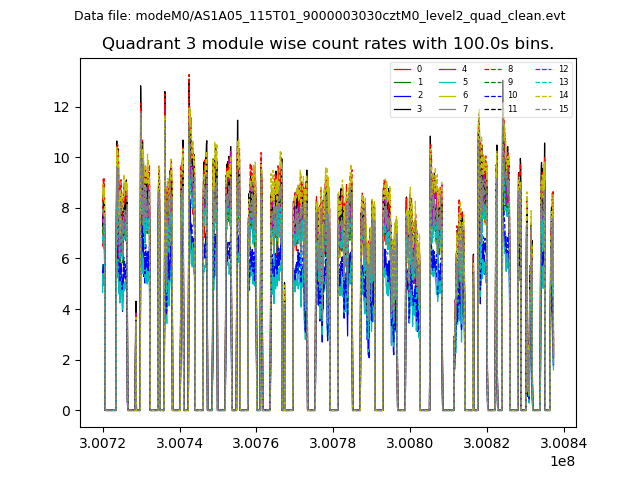
| Module-wise count rates for Quadrant C Data is divided into 100 sec bins |
 |
 |
| Module-wise count rates for Quadrant D Data is divided into 100 sec bins |
 |
 |
| Parameter | Plot |
|---|---|
| CZT HV Monitor | 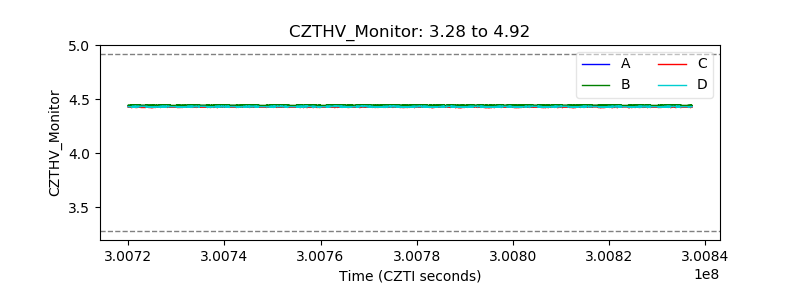 |
| D_VDD |  |
| Temperature 1 |  |
| Veto HV Monitor |  |
| Veto LLD |  |
| Alpha Counter |  |
| _CPM_Rate |  |
| CZT Counter |  |
| +2.5 Volts monitor |  |
| +5 Volts monitor | 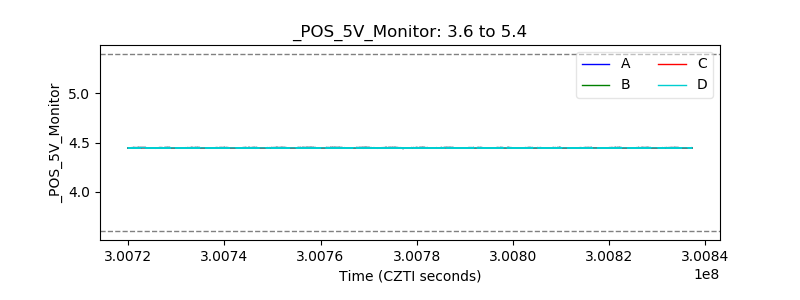 |
| _ROLL_ROT |  |
| _Roll_DEC |  |
| _Roll_RA | 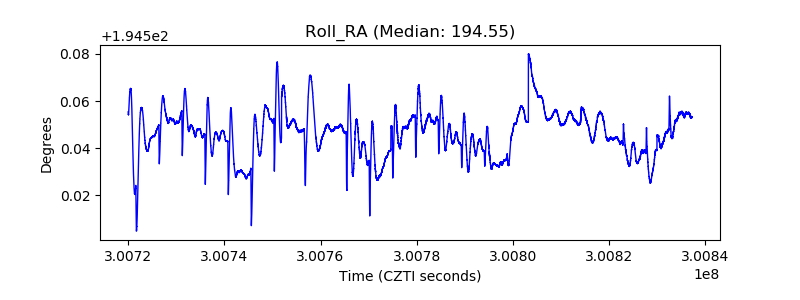 |
| Veto Counter |  |