| Param | Original file | Final file |
|---|---|---|
| Filename | modeM0/AS1A05_198T01_9000003024cztM0_level2_bc.evt | modeM0/AS1A05_198T01_9000003024cztM0_level2_quad_clean.evt |
| Size (bytes) | 2,502,823,680 | 951,802,560 |
| Size | 2.3 GB | 907.7 MB |
| Events in quadrant A | 15,000,762 | 6,162,547 |
| Events in quadrant B | 17,333,104 | 6,226,573 |
| Events in quadrant C | 16,620,302 | 5,926,077 |
| Events in quadrant D | 22,082,604 | 5,724,483 |
| Mode M9 | |||
|---|---|---|---|
| Quadrant | BADHDUFLAG | Total packets | Discarded packets |
| A | 0 | 110 | 0 |
| B | 0 | 110 | 0 |
| C | 0 | 110 | 0 |
| D | 0 | 110 | 0 |
| Mode SS | |||
|---|---|---|---|
| Quadrant | BADHDUFLAG | Total packets | Discarded packets |
| A | 0 | 1422 | 0 |
| B | 0 | 1422 | 0 |
| C | 0 | 1422 | 0 |
| D | 0 | 1422 | 0 |
| Mode M0 | |||
|---|---|---|---|
| Quadrant | BADHDUFLAG | Total packets | Discarded packets |
| A | 0 | 146334 | 0 |
| B | 0 | 155988 | 0 |
| C | 0 | 154189 | 0 |
| D | 0 | 174085 | 0 |
| Quadrant | Total seconds | Saturated seconds | Saturation percentage |
|---|---|---|---|
| A | 69850 | 1023 | 1.464567% |
| B | 69851 | 1558 | 2.230462% |
| C | 69851 | 1505 | 2.154586% |
| D | 69851 | 2875 | 4.115904% |
Noise dominated data is calculated using 1-second bins in cleaned event files. If a bin has >2000 counts, and if more than 50% of those come from <1% of pixels, then it is considered to be noise-dominated and hence unusable.
| Quadrant | # 1 sec bins | Bins with >0 counts | Bins with >2000 counts | High rate bins dominated by noise | Noise dominated (total time) | Noise dominated (detector-on time) | Marked lightcurve |
|---|---|---|---|---|---|---|---|
| A | 80900 | 69843 | 0 | 0 | 0.00% | 0.00% |  |
| B | 80901 | 69843 | 11 | 11 | 0.01% | 0.02% |  |
| C | 80901 | 69845 | 11 | 11 | 0.01% | 0.02% |  |
| D | 80901 | 69845 | 219 | 219 | 0.27% | 0.31% |  |
Top three noisy pixels from each quadrant. If the there are fewer than three noisy pixels in the level2.evt file, extra rows are filled as -1
| Pixel properties | Quadrant properties | ||||||
|---|---|---|---|---|---|---|---|
| Quadrant | DetID | PixID | Counts | Sigma | Mean | Median | Sigma |
| A | 15 | 222 | 229934 | 274.12 | 3816 | 3740 | 825.2 |
| A | 13 | 254 | 69937 | 80.22 | 3816 | 3740 | 825.2 |
| A | 12 | 16 | 40210 | 44.2 | 3816 | 3740 | 825.2 |
| B | 0 | 189 | 742638 | 1024.52 | 3832 | 3737 | 721.2 |
| B | 7 | 220 | 617312 | 850.75 | 3832 | 3737 | 721.2 |
| B | 0 | 197 | 306889 | 420.33 | 3832 | 3737 | 721.2 |
| C | 3 | 233 | 1296513 | 1512.95 | 3670 | 3656 | 854.5 |
| C | 3 | 9 | 887447 | 1034.24 | 3670 | 3656 | 854.5 |
| C | 9 | 221 | 194058 | 222.81 | 3670 | 3656 | 854.5 |
| D | 15 | 0 | 2787209 | 3202.4 | 3714 | 3579 | 869.2 |
| D | 1 | 52 | 2462050 | 2828.32 | 3714 | 3579 | 869.2 |
| D | 12 | 218 | 1129725 | 1295.56 | 3714 | 3579 | 869.2 |
Histogram calculated using DETX and DETY for each event in the final _common_clean file
| Quadrant A |  |
 |
Quadrant B |
|---|---|---|---|
| Quadrant D |  |
 |
Quadrant C |
| Plot type | Count rate plots | Images |
|---|---|---|
| Comparison with Poisson distribution Blue bars denote a histogram of data divided into 1 sec bins. Red curve is a Poisson curve with rate = median count rate of data. |
 |
 |
| Quadrant-wise count rates Data is divided into 100 sec bins |
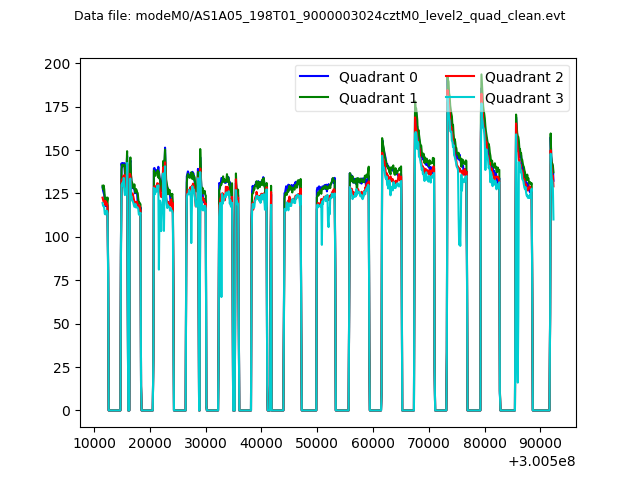 |
|
| Module-wise count rates for Quadrant A Data is divided into 100 sec bins |
 |
 |
| Module-wise count rates for Quadrant B Data is divided into 100 sec bins |
 |
 |
| Module-wise count rates for Quadrant C Data is divided into 100 sec bins |
 |
 |
| Module-wise count rates for Quadrant D Data is divided into 100 sec bins |
 |
 |
| Parameter | Plot |
|---|---|
| CZT HV Monitor |  |
| D_VDD |  |
| Temperature 1 |  |
| Veto HV Monitor |  |
| Veto LLD |  |
| Alpha Counter |  |
| _CPM_Rate |  |
| CZT Counter |  |
| +2.5 Volts monitor | 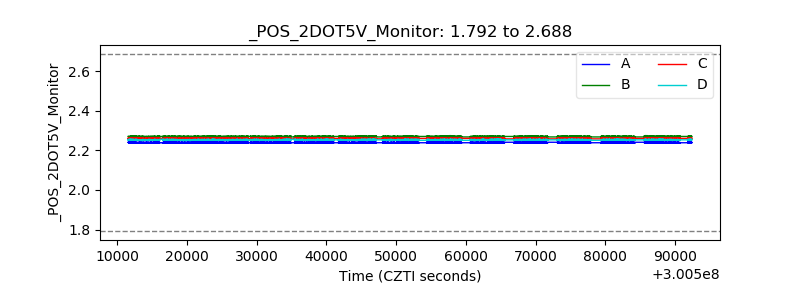 |
| +5 Volts monitor |  |
| _ROLL_ROT |  |
| _Roll_DEC |  |
| _Roll_RA |  |
| Veto Counter |  |