| Param | Original file | Final file |
|---|---|---|
| Filename | modeM0/AS1C04_009T06_9000003020cztM0_level2_bc.evt | modeM0/AS1C04_009T06_9000003020cztM0_level2_quad_clean.evt |
| Size (bytes) | 526,080,960 | 288,982,080 |
| Size | 501.7 MB | 275.6 MB |
| Events in quadrant A | 3,298,967 | 1,967,254 |
| Events in quadrant B | 3,923,737 | 1,976,623 |
| Events in quadrant C | 3,369,688 | 1,900,870 |
| Events in quadrant D | 4,292,249 | 1,855,237 |
| Mode M0 | |||
|---|---|---|---|
| Quadrant | BADHDUFLAG | Total packets | Discarded packets |
| A | 0 | 31871 | 0 |
| B | 0 | 34437 | 0 |
| C | 0 | 32327 | 0 |
| D | 0 | 36748 | 0 |
| Mode SS | |||
|---|---|---|---|
| Quadrant | BADHDUFLAG | Total packets | Discarded packets |
| A | 0 | 310 | 0 |
| B | 0 | 310 | 0 |
| C | 0 | 310 | 0 |
| D | 0 | 310 | 0 |
| Mode M9 | |||
|---|---|---|---|
| Quadrant | BADHDUFLAG | Total packets | Discarded packets |
| A | 0 | 5 | 0 |
| B | 0 | 5 | 0 |
| C | 0 | 5 | 0 |
| D | 0 | 5 | 0 |
| Quadrant | Total seconds | Saturated seconds | Saturation percentage |
|---|---|---|---|
| A | 15258 | 228 | 1.494298% |
| B | 15258 | 299 | 1.959628% |
| C | 15258 | 206 | 1.350111% |
| D | 15258 | 604 | 3.958579% |
Noise dominated data is calculated using 1-second bins in cleaned event files. If a bin has >2000 counts, and if more than 50% of those come from <1% of pixels, then it is considered to be noise-dominated and hence unusable.
| Quadrant | # 1 sec bins | Bins with >0 counts | Bins with >2000 counts | High rate bins dominated by noise | Noise dominated (total time) | Noise dominated (detector-on time) | Marked lightcurve |
|---|---|---|---|---|---|---|---|
| A | 15938 | 15257 | 2 | 2 | 0.01% | 0.01% |  |
| B | 15938 | 15256 | 2 | 2 | 0.01% | 0.01% |  |
| C | 15938 | 15258 | 0 | 0 | 0.00% | 0.00% |  |
| D | 15938 | 15255 | 46 | 46 | 0.29% | 0.30% |  |
Top three noisy pixels from each quadrant. If the there are fewer than three noisy pixels in the level2.evt file, extra rows are filled as -1
| Pixel properties | Quadrant properties | ||||||
|---|---|---|---|---|---|---|---|
| Quadrant | DetID | PixID | Counts | Sigma | Mean | Median | Sigma |
| A | 5 | 16 | 127270 | 714.01 | 787 | 774 | 177.2 |
| A | 12 | 16 | 71134 | 397.15 | 787 | 774 | 177.2 |
| A | 14 | 111 | 41059 | 227.39 | 787 | 774 | 177.2 |
| B | 0 | 197 | 268301 | 1767.32 | 788 | 770 | 151.4 |
| B | 7 | 220 | 131997 | 866.89 | 788 | 770 | 151.4 |
| B | 0 | 189 | 125506 | 824.01 | 788 | 770 | 151.4 |
| C | 9 | 54 | 399187 | 2209.43 | 757 | 754 | 180.3 |
| C | 3 | 233 | 42272 | 230.23 | 757 | 754 | 180.3 |
| C | 8 | 128 | 8167 | 41.11 | 757 | 754 | 180.3 |
| D | 1 | 52 | 460653 | 2498.84 | 768 | 741 | 184.1 |
| D | 12 | 218 | 369093 | 2001.36 | 768 | 741 | 184.1 |
| D | 13 | 153 | 140802 | 760.99 | 768 | 741 | 184.1 |
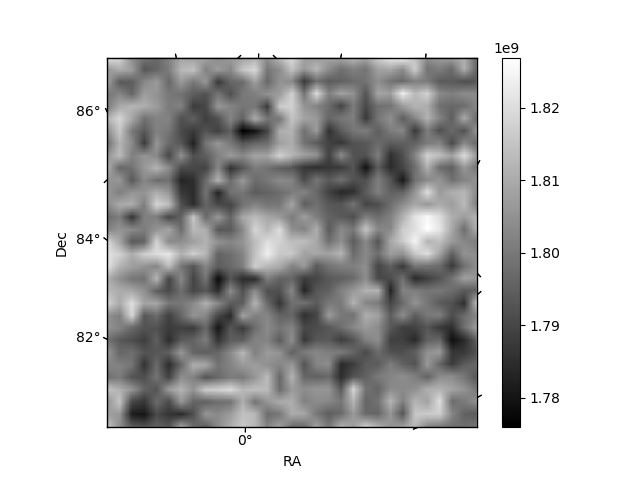
Histogram calculated using DETX and DETY for each event in the final _common_clean file
| Quadrant A |  |
 |
Quadrant B |
|---|---|---|---|
| Quadrant D |  |
 |
Quadrant C |
| Plot type | Count rate plots | Images |
|---|---|---|
| Comparison with Poisson distribution Blue bars denote a histogram of data divided into 1 sec bins. Red curve is a Poisson curve with rate = median count rate of data. |
 |
 |
| Quadrant-wise count rates Data is divided into 100 sec bins |
 |
|
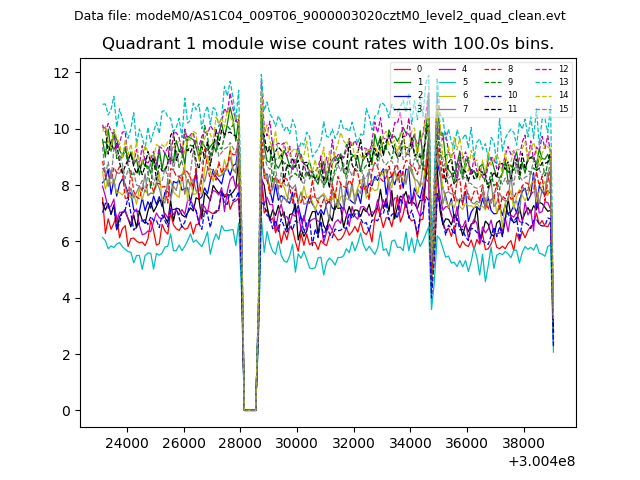
| Module-wise count rates for Quadrant A Data is divided into 100 sec bins |
 |
 |
| Module-wise count rates for Quadrant B Data is divided into 100 sec bins |
 |
 |
| Module-wise count rates for Quadrant C Data is divided into 100 sec bins |
 |
 |
| Module-wise count rates for Quadrant D Data is divided into 100 sec bins |
 |
 |
| Parameter | Plot |
|---|---|
| CZT HV Monitor |  |
| D_VDD |  |
| Temperature 1 |  |
| Veto HV Monitor | 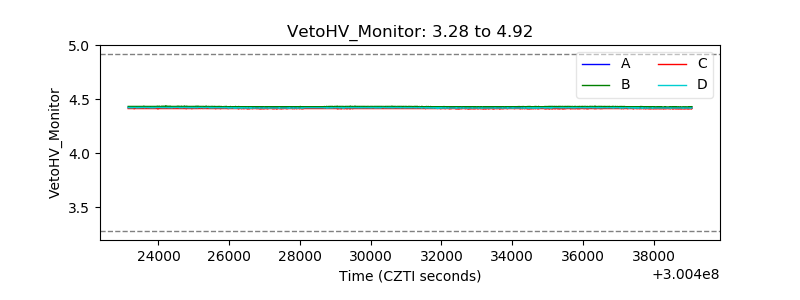 |
| Veto LLD |  |
| Alpha Counter |  |
| _CPM_Rate | 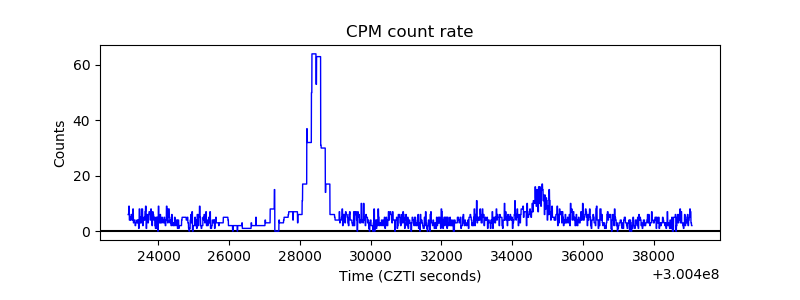 |
| CZT Counter |  |
| +2.5 Volts monitor |  |
| +5 Volts monitor |  |
| _ROLL_ROT |  |
| _Roll_DEC |  |
| _Roll_RA |  |
| Veto Counter | 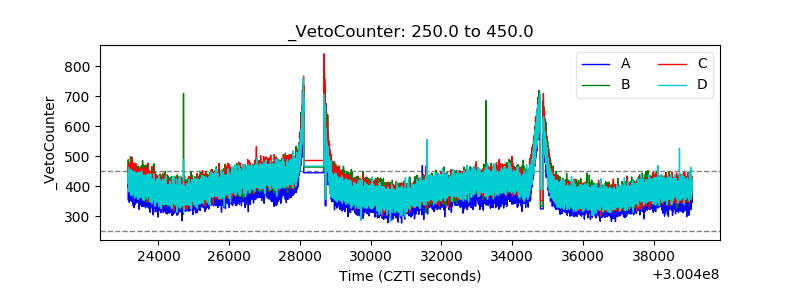 |