| Param | Original file | Final file |
|---|---|---|
| Filename | modeM0/AS1A05_160T02_9000003022cztM0_level2_bc.evt | modeM0/AS1A05_160T02_9000003022cztM0_level2_quad_clean.evt |
| Size (bytes) | 2,197,500,480 | 686,191,680 |
| Size | 2.0 GB | 654.4 MB |
| Events in quadrant A | 13,181,081 | 4,353,256 |
| Events in quadrant B | 14,950,423 | 4,407,966 |
| Events in quadrant C | 12,790,283 | 4,174,832 |
| Events in quadrant D | 21,731,264 | 3,923,797 |
| Mode SS | |||
|---|---|---|---|
| Quadrant | BADHDUFLAG | Total packets | Discarded packets |
| A | 0 | 1160 | 0 |
| B | 0 | 1162 | 0 |
| C | 0 | 1162 | 0 |
| D | 0 | 1162 | 0 |
| Mode M0 | |||
|---|---|---|---|
| Quadrant | BADHDUFLAG | Total packets | Discarded packets |
| A | 0 | 122756 | 0 |
| B | 0 | 130423 | 0 |
| C | 0 | 122210 | 0 |
| D | 0 | 154226 | 0 |
| Mode M9 | |||
|---|---|---|---|
| Quadrant | BADHDUFLAG | Total packets | Discarded packets |
| A | 0 | 104 | 0 |
| B | 0 | 104 | 0 |
| C | 0 | 104 | 0 |
| D | 0 | 104 | 0 |
| Quadrant | Total seconds | Saturated seconds | Saturation percentage |
|---|---|---|---|
| A | 57197 | 998 | 1.744847% |
| B | 57192 | 1269 | 2.218842% |
| C | 57210 | 1064 | 1.859815% |
| D | 57200 | 3027 | 5.291958% |
Noise dominated data is calculated using 1-second bins in cleaned event files. If a bin has >2000 counts, and if more than 50% of those come from <1% of pixels, then it is considered to be noise-dominated and hence unusable.
| Quadrant | # 1 sec bins | Bins with >0 counts | Bins with >2000 counts | High rate bins dominated by noise | Noise dominated (total time) | Noise dominated (detector-on time) | Marked lightcurve |
|---|---|---|---|---|---|---|---|
| A | 67576 | 57235 | 21 | 21 | 0.03% | 0.04% |  |
| B | 67551 | 57260 | 12 | 12 | 0.02% | 0.02% |  |
| C | 67590 | 57271 | 23 | 23 | 0.03% | 0.04% |  |
| D | 67548 | 57268 | 477 | 477 | 0.71% | 0.83% |  |
Top three noisy pixels from each quadrant. If the there are fewer than three noisy pixels in the level2.evt file, extra rows are filled as -1
| Pixel properties | Quadrant properties | ||||||
|---|---|---|---|---|---|---|---|
| Quadrant | DetID | PixID | Counts | Sigma | Mean | Median | Sigma |
| A | 5 | 16 | 472180 | 698.77 | 3091 | 3038 | 671.4 |
| A | 6 | 240 | 261813 | 385.44 | 3091 | 3038 | 671.4 |
| A | 15 | 222 | 244941 | 360.31 | 3091 | 3038 | 671.4 |
| B | 0 | 189 | 773607 | 1314.25 | 3137 | 3064 | 586.3 |
| B | 7 | 220 | 470351 | 797.01 | 3137 | 3064 | 586.3 |
| B | 0 | 197 | 388425 | 657.28 | 3137 | 3064 | 586.3 |
| C | 9 | 221 | 734663 | 1053.98 | 2974 | 2964 | 694.2 |
| C | 3 | 233 | 545393 | 781.35 | 2974 | 2964 | 694.2 |
| C | 9 | 54 | 35111 | 46.31 | 2974 | 2964 | 694.2 |
| D | 1 | 52 | 2791360 | 4057.81 | 2966 | 2867 | 687.2 |
| D | 15 | 0 | 2038006 | 2961.53 | 2966 | 2867 | 687.2 |
| D | 12 | 218 | 1701970 | 2472.53 | 2966 | 2867 | 687.2 |
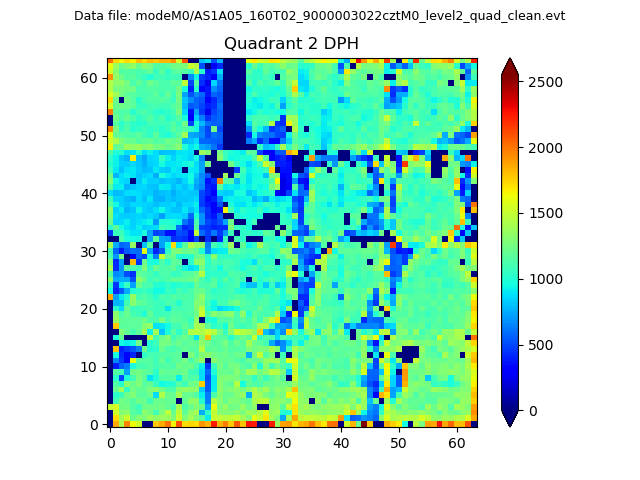
Histogram calculated using DETX and DETY for each event in the final _common_clean file
| Quadrant A |  |
 |
Quadrant B |
|---|---|---|---|
| Quadrant D |  |
 |
Quadrant C |
| Plot type | Count rate plots | Images |
|---|---|---|
| Comparison with Poisson distribution Blue bars denote a histogram of data divided into 1 sec bins. Red curve is a Poisson curve with rate = median count rate of data. |
 |
 |
| Quadrant-wise count rates Data is divided into 100 sec bins |
 |
|
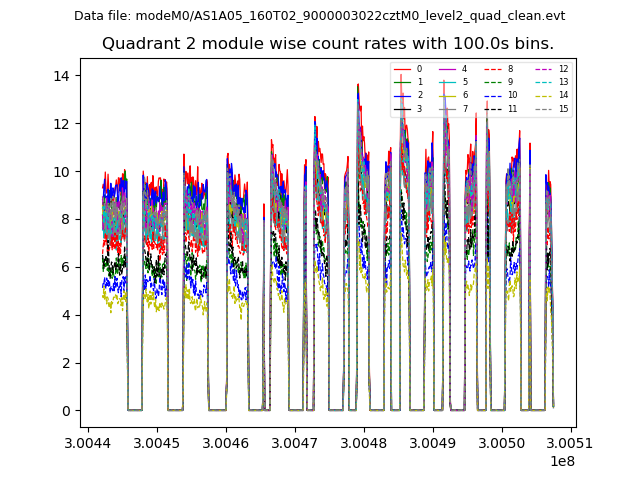
| Module-wise count rates for Quadrant A Data is divided into 100 sec bins |
 |
 |
| Module-wise count rates for Quadrant B Data is divided into 100 sec bins |
 |
 |
| Module-wise count rates for Quadrant C Data is divided into 100 sec bins |
 |
 |
| Module-wise count rates for Quadrant D Data is divided into 100 sec bins |
 |
 |
| Parameter | Plot |
|---|---|
| CZT HV Monitor |  |
| D_VDD |  |
| Temperature 1 |  |
| Veto HV Monitor |  |
| Veto LLD | 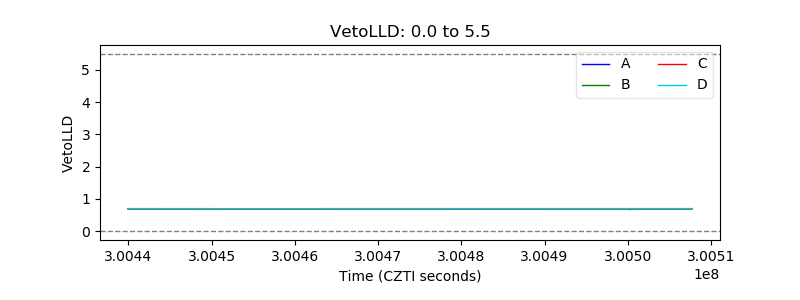 |
| Alpha Counter |  |
| _CPM_Rate | 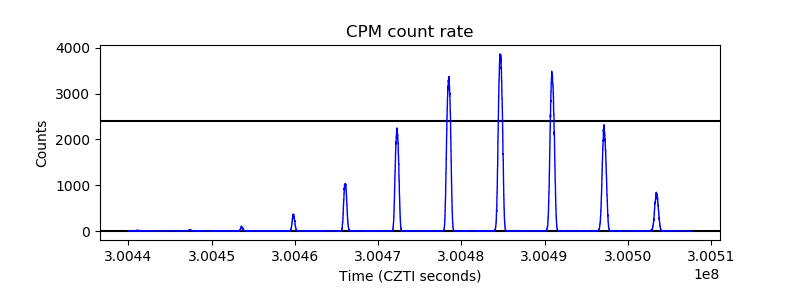 |
| CZT Counter |  |
| +2.5 Volts monitor |  |
| +5 Volts monitor |  |
| _ROLL_ROT |  |
| _Roll_DEC |  |
| _Roll_RA |  |
| Veto Counter |  |