| Param | Original file | Final file |
|---|---|---|
| Filename | modeM0/AS1A05_188T01_9000003018cztM0_level2_bc.evt | modeM0/AS1A05_188T01_9000003018cztM0_level2_quad_clean.evt |
| Size (bytes) | 3,954,139,200 | 1,379,692,800 |
| Size | 3.7 GB | 1.3 GB |
| Events in quadrant A | 22,768,854 | 8,897,067 |
| Events in quadrant B | 25,619,220 | 8,994,606 |
| Events in quadrant C | 21,853,643 | 8,590,332 |
| Events in quadrant D | 42,465,150 | 8,217,036 |
| Mode SS | |||
|---|---|---|---|
| Quadrant | BADHDUFLAG | Total packets | Discarded packets |
| A | 0 | 2110 | 0 |
| B | 0 | 2110 | 0 |
| C | 0 | 2110 | 0 |
| D | 0 | 2110 | 0 |
| Mode M9 | |||
|---|---|---|---|
| Quadrant | BADHDUFLAG | Total packets | Discarded packets |
| A | 0 | 190 | 0 |
| B | 0 | 190 | 0 |
| C | 0 | 190 | 0 |
| D | 0 | 190 | 0 |
| Mode M0 | |||
|---|---|---|---|
| Quadrant | BADHDUFLAG | Total packets | Discarded packets |
| A | 0 | 215641 | 0 |
| B | 0 | 225166 | 0 |
| C | 0 | 215406 | 0 |
| D | 0 | 278433 | 0 |
| Quadrant | Total seconds | Saturated seconds | Saturation percentage |
|---|---|---|---|
| A | 103466 | 1093 | 1.056386% |
| B | 103466 | 1622 | 1.567665% |
| C | 103466 | 1469 | 1.419790% |
| D | 103466 | 5699 | 5.508090% |
Noise dominated data is calculated using 1-second bins in cleaned event files. If a bin has >2000 counts, and if more than 50% of those come from <1% of pixels, then it is considered to be noise-dominated and hence unusable.
| Quadrant | # 1 sec bins | Bins with >0 counts | Bins with >2000 counts | High rate bins dominated by noise | Noise dominated (total time) | Noise dominated (detector-on time) | Marked lightcurve |
|---|---|---|---|---|---|---|---|
| A | 122301 | 103461 | 5 | 5 | 0.00% | 0.00% |  |
| B | 122300 | 103462 | 28 | 28 | 0.02% | 0.03% |  |
| C | 122301 | 103465 | 4 | 4 | 0.00% | 0.00% |  |
| D | 122301 | 103468 | 2553 | 2553 | 2.09% | 2.47% |  |
Top three noisy pixels from each quadrant. If the there are fewer than three noisy pixels in the level2.evt file, extra rows are filled as -1
| Pixel properties | Quadrant properties | ||||||
|---|---|---|---|---|---|---|---|
| Quadrant | DetID | PixID | Counts | Sigma | Mean | Median | Sigma |
| A | 5 | 16 | 294847 | 230.64 | 5825 | 5735 | 1253.5 |
| A | 13 | 254 | 77695 | 57.41 | 5825 | 5735 | 1253.5 |
| A | 12 | 96 | 42310 | 29.18 | 5825 | 5735 | 1253.5 |
| B | 10 | 245 | 2306708 | 2106.61 | 5855 | 5723 | 1092.3 |
| B | 0 | 189 | 178426 | 158.11 | 5855 | 5723 | 1092.3 |
| B | 0 | 219 | 177576 | 157.34 | 5855 | 5723 | 1092.3 |
| C | 3 | 247 | 193137 | 145.37 | 5566 | 5550 | 1290.4 |
| C | 3 | 233 | 152839 | 114.14 | 5566 | 5550 | 1290.4 |
| C | 9 | 221 | 39440 | 26.26 | 5566 | 5550 | 1290.4 |
| D | 2 | 16 | 9555310 | 7466.18 | 5596 | 5421 | 1279.1 |
| D | 1 | 52 | 7912250 | 6181.62 | 5596 | 5421 | 1279.1 |
| D | 13 | 153 | 2152642 | 1678.71 | 5596 | 5421 | 1279.1 |
Histogram calculated using DETX and DETY for each event in the final _common_clean file
| Quadrant A |  |
 |
Quadrant B |
|---|---|---|---|
| Quadrant D |  |
 |
Quadrant C |
| Plot type | Count rate plots | Images |
|---|---|---|
| Comparison with Poisson distribution Blue bars denote a histogram of data divided into 1 sec bins. Red curve is a Poisson curve with rate = median count rate of data. |
 |
 |
| Quadrant-wise count rates Data is divided into 100 sec bins |
 |
|
| Module-wise count rates for Quadrant A Data is divided into 100 sec bins |
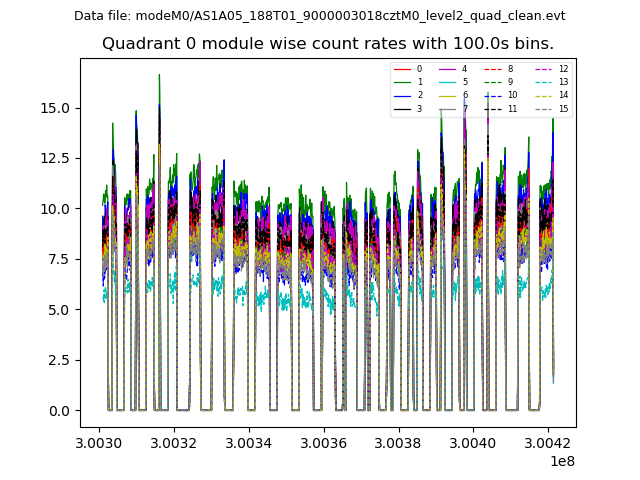 |
 |
| Module-wise count rates for Quadrant B Data is divided into 100 sec bins |
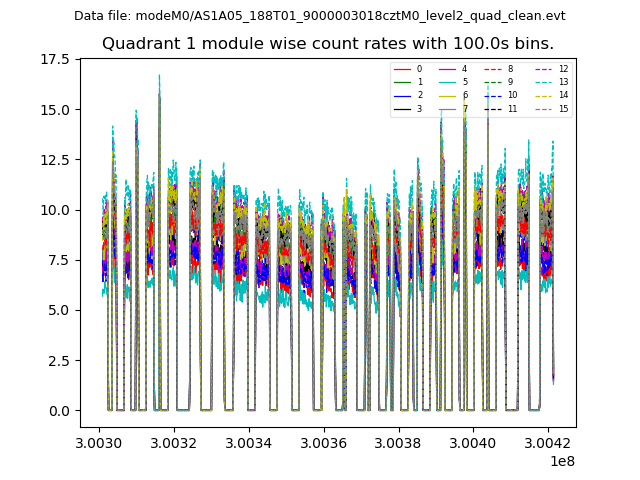 |
 |
| Module-wise count rates for Quadrant C Data is divided into 100 sec bins |
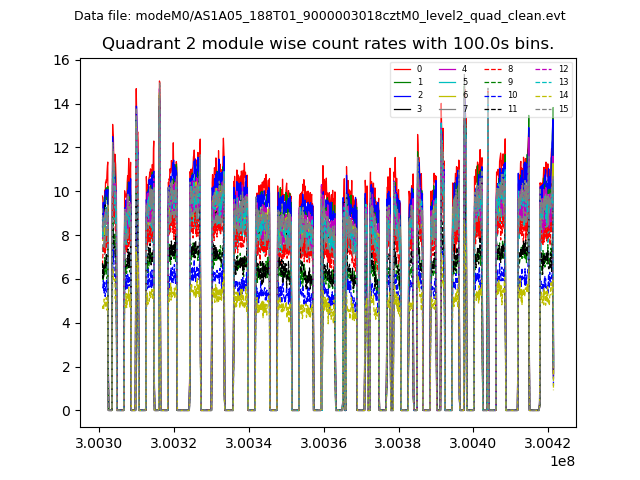 |
 |
| Module-wise count rates for Quadrant D Data is divided into 100 sec bins |
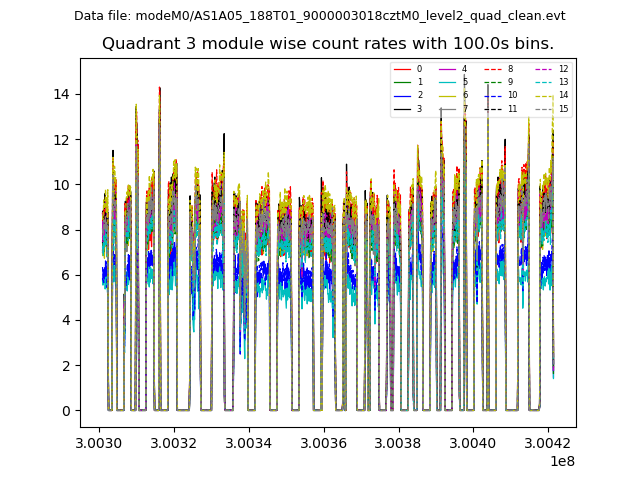 |
 |
| Parameter | Plot |
|---|---|
| CZT HV Monitor |  |
| D_VDD | 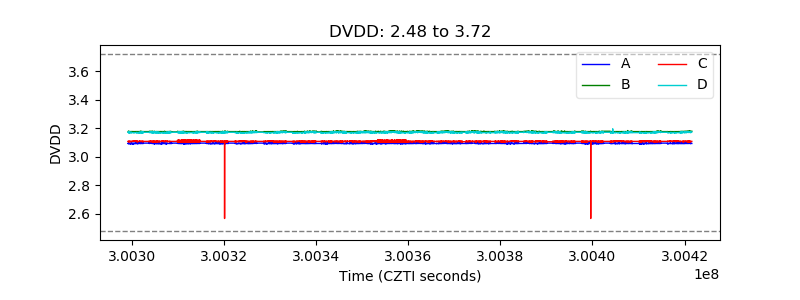 |
| Temperature 1 | 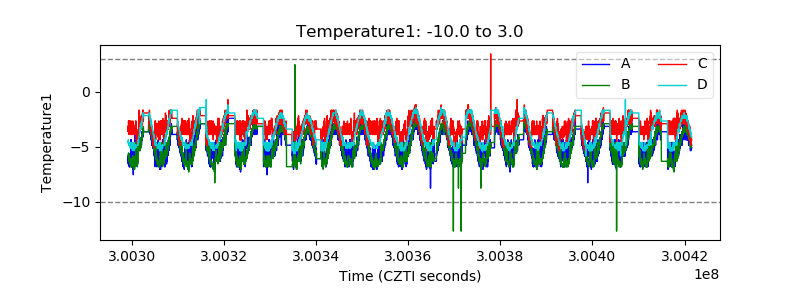 |
| Veto HV Monitor |  |
| Veto LLD |  |
| Alpha Counter |  |
| _CPM_Rate |  |
| CZT Counter |  |
| +2.5 Volts monitor |  |
| +5 Volts monitor | 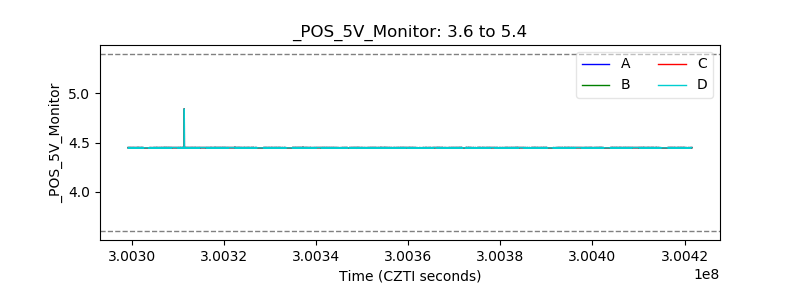 |
| _ROLL_ROT |  |
| _Roll_DEC |  |
| _Roll_RA | 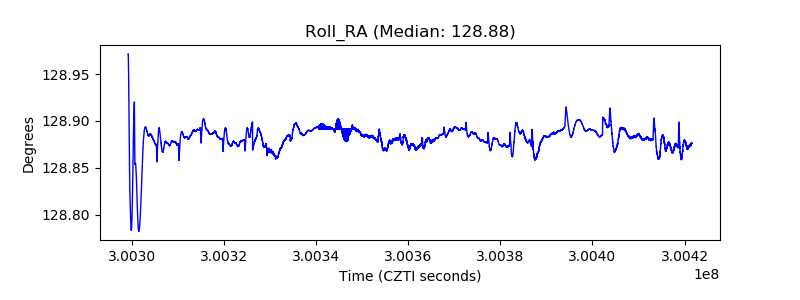 |
| Veto Counter |  |