| Param | Original file | Final file |
|---|---|---|
| Filename | modeM0/AS1A05_140T01_9000003016cztM0_level2_bc.evt | modeM0/AS1A05_140T01_9000003016cztM0_level2_quad_clean.evt |
| Size (bytes) | 2,633,685,120 | 1,071,397,440 |
| Size | 2.5 GB | 1021.8 MB |
| Events in quadrant A | 17,326,735 | 6,938,776 |
| Events in quadrant B | 18,589,683 | 6,948,503 |
| Events in quadrant C | 16,382,342 | 6,654,079 |
| Events in quadrant D | 22,110,653 | 6,528,671 |
| Mode SS | |||
|---|---|---|---|
| Quadrant | BADHDUFLAG | Total packets | Discarded packets |
| A | 0 | 1600 | 0 |
| B | 0 | 1600 | 0 |
| C | 0 | 1600 | 0 |
| D | 0 | 1600 | 0 |
| Mode M9 | |||
|---|---|---|---|
| Quadrant | BADHDUFLAG | Total packets | Discarded packets |
| A | 0 | 132 | 0 |
| B | 0 | 132 | 0 |
| C | 0 | 132 | 0 |
| D | 0 | 132 | 0 |
| Mode M0 | |||
|---|---|---|---|
| Quadrant | BADHDUFLAG | Total packets | Discarded packets |
| A | 0 | 163607 | 0 |
| B | 0 | 168497 | 0 |
| C | 0 | 163126 | 0 |
| D | 0 | 180275 | 0 |
| Quadrant | Total seconds | Saturated seconds | Saturation percentage |
|---|---|---|---|
| A | 78520 | 823 | 1.048141% |
| B | 78520 | 1108 | 1.411105% |
| C | 78520 | 1194 | 1.520632% |
| D | 78520 | 1683 | 2.143403% |
Noise dominated data is calculated using 1-second bins in cleaned event files. If a bin has >2000 counts, and if more than 50% of those come from <1% of pixels, then it is considered to be noise-dominated and hence unusable.
| Quadrant | # 1 sec bins | Bins with >0 counts | Bins with >2000 counts | High rate bins dominated by noise | Noise dominated (total time) | Noise dominated (detector-on time) | Marked lightcurve |
|---|---|---|---|---|---|---|---|
| A | 91676 | 78521 | 1 | 1 | 0.00% | 0.00% |  |
| B | 91676 | 78519 | 4 | 4 | 0.00% | 0.01% |  |
| C | 91676 | 78518 | 0 | 0 | 0.00% | 0.00% |  |
| D | 91676 | 78519 | 237 | 237 | 0.26% | 0.30% |  |
Top three noisy pixels from each quadrant. If the there are fewer than three noisy pixels in the level2.evt file, extra rows are filled as -1
| Pixel properties | Quadrant properties | ||||||
|---|---|---|---|---|---|---|---|
| Quadrant | DetID | PixID | Counts | Sigma | Mean | Median | Sigma |
| A | 12 | 16 | 333202 | 347.38 | 4373 | 4315 | 946.8 |
| A | 12 | 194 | 76927 | 76.69 | 4373 | 4315 | 946.8 |
| A | 13 | 254 | 62971 | 61.95 | 4373 | 4315 | 946.8 |
| B | 10 | 245 | 737154 | 887.74 | 4383 | 4294 | 825.5 |
| B | 0 | 189 | 408879 | 490.09 | 4383 | 4294 | 825.5 |
| B | 4 | 216 | 198923 | 235.76 | 4383 | 4294 | 825.5 |
| C | 7 | 220 | 129178 | 128.37 | 4171 | 4166 | 973.9 |
| C | 3 | 233 | 102047 | 100.51 | 4171 | 4166 | 973.9 |
| C | 0 | 207 | 43064 | 39.94 | 4171 | 4166 | 973.9 |
| D | 1 | 52 | 2837572 | 2877.59 | 4261 | 4133 | 984.7 |
| D | 13 | 153 | 1063189 | 1075.56 | 4261 | 4133 | 984.7 |
| D | 2 | 16 | 1007096 | 1018.59 | 4261 | 4133 | 984.7 |
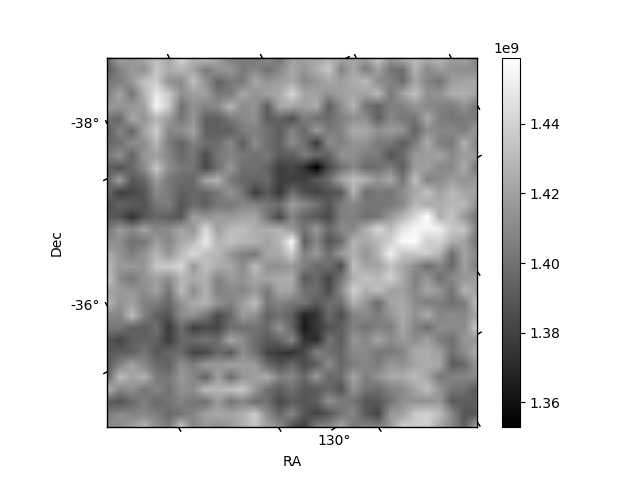
Histogram calculated using DETX and DETY for each event in the final _common_clean file
| Quadrant A |  |
 |
Quadrant B |
|---|---|---|---|
| Quadrant D |  |
 |
Quadrant C |
| Plot type | Count rate plots | Images |
|---|---|---|
| Comparison with Poisson distribution Blue bars denote a histogram of data divided into 1 sec bins. Red curve is a Poisson curve with rate = median count rate of data. |
 |
 |
| Quadrant-wise count rates Data is divided into 100 sec bins |
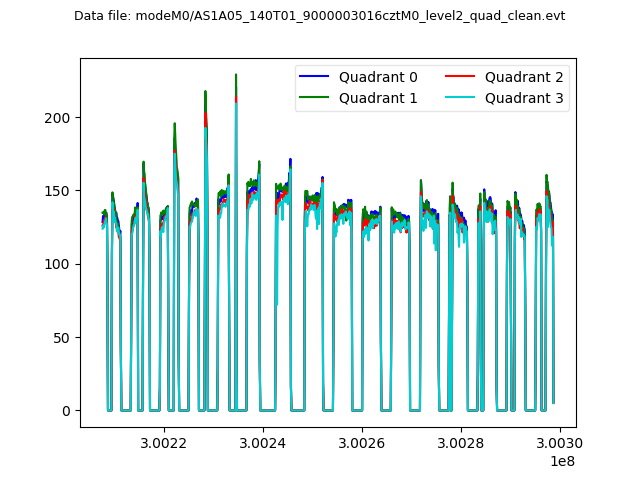 |
|
| Module-wise count rates for Quadrant A Data is divided into 100 sec bins |
 |
 |
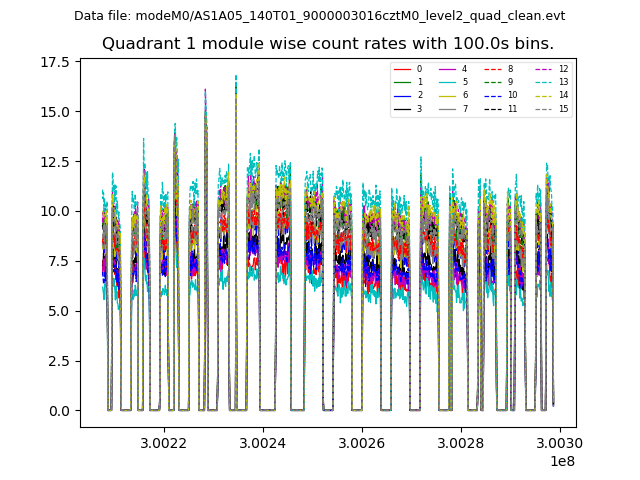
| Module-wise count rates for Quadrant B Data is divided into 100 sec bins |
 |
 |
| Module-wise count rates for Quadrant C Data is divided into 100 sec bins |
 |
 |
| Module-wise count rates for Quadrant D Data is divided into 100 sec bins |
 |
 |
| Parameter | Plot |
|---|---|
| CZT HV Monitor |  |
| D_VDD |  |
| Temperature 1 |  |
| Veto HV Monitor | 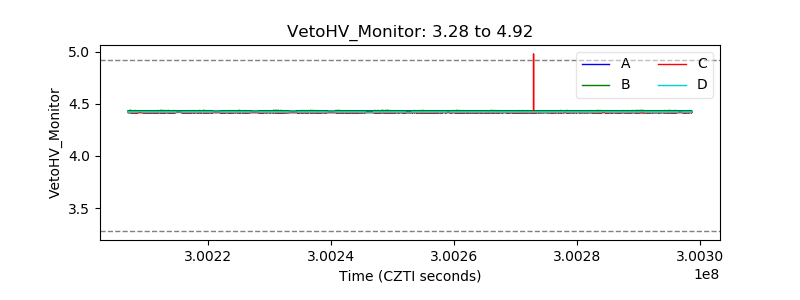 |
| Veto LLD |  |
| Alpha Counter |  |
| _CPM_Rate |  |
| CZT Counter |  |
| +2.5 Volts monitor |  |
| +5 Volts monitor |  |
| _ROLL_ROT | 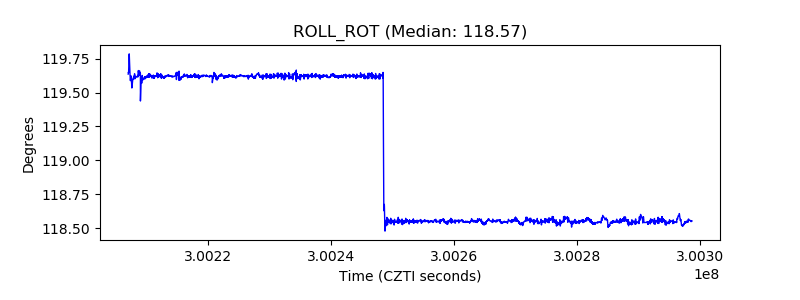 |
| _Roll_DEC |  |
| _Roll_RA | 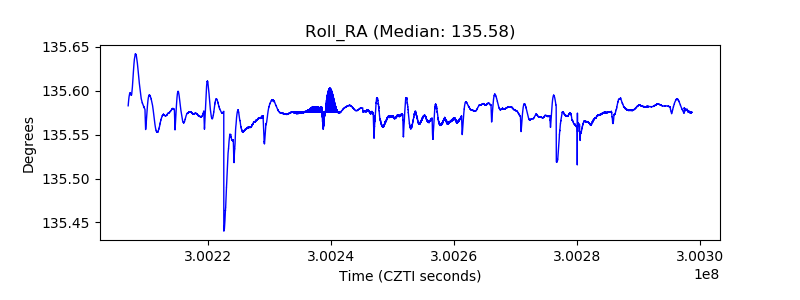 |
| Veto Counter |  |