| Param | Original file | Final file |
|---|---|---|
| Filename | modeM0/AS1A05_198T01_9000003014cztM0_level2_bc.evt | modeM0/AS1A05_198T01_9000003014cztM0_level2_quad_clean.evt |
| Size (bytes) | 3,140,925,120 | 1,033,349,760 |
| Size | 2.9 GB | 985.5 MB |
| Events in quadrant A | 17,653,450 | 6,632,871 |
| Events in quadrant B | 19,109,023 | 6,702,206 |
| Events in quadrant C | 16,151,288 | 6,421,350 |
| Events in quadrant D | 36,815,386 | 6,114,376 |
| Mode SS | |||
|---|---|---|---|
| Quadrant | BADHDUFLAG | Total packets | Discarded packets |
| A | 0 | 1614 | 0 |
| B | 0 | 1614 | 0 |
| C | 0 | 1614 | 0 |
| D | 0 | 1614 | 0 |
| Mode M0 | |||
|---|---|---|---|
| Quadrant | BADHDUFLAG | Total packets | Discarded packets |
| A | 0 | 168984 | 0 |
| B | 0 | 175586 | 0 |
| C | 0 | 165558 | 0 |
| D | 0 | 236126 | 0 |
| Mode M9 | |||
|---|---|---|---|
| Quadrant | BADHDUFLAG | Total packets | Discarded packets |
| A | 0 | 127 | 0 |
| B | 0 | 127 | 0 |
| C | 0 | 127 | 0 |
| D | 0 | 127 | 0 |
| Quadrant | Total seconds | Saturated seconds | Saturation percentage |
|---|---|---|---|
| A | 79169 | 1245 | 1.572585% |
| B | 79169 | 1711 | 2.161199% |
| C | 79169 | 1295 | 1.635741% |
| D | 79169 | 7578 | 9.571928% |
Noise dominated data is calculated using 1-second bins in cleaned event files. If a bin has >2000 counts, and if more than 50% of those come from <1% of pixels, then it is considered to be noise-dominated and hence unusable.
| Quadrant | # 1 sec bins | Bins with >0 counts | Bins with >2000 counts | High rate bins dominated by noise | Noise dominated (total time) | Noise dominated (detector-on time) | Marked lightcurve |
|---|---|---|---|---|---|---|---|
| A | 91919 | 79173 | 36 | 36 | 0.04% | 0.05% | 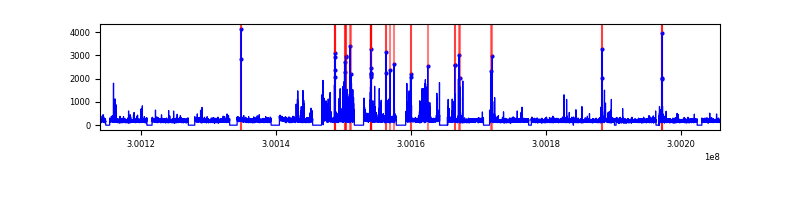 |
| B | 91919 | 79167 | 22 | 22 | 0.02% | 0.03% |  |
| C | 91919 | 79171 | 0 | 0 | 0.00% | 0.00% |  |
| D | 91919 | 79168 | 1783 | 1783 | 1.94% | 2.25% |  |
Top three noisy pixels from each quadrant. If the there are fewer than three noisy pixels in the level2.evt file, extra rows are filled as -1
| Pixel properties | Quadrant properties | ||||||
|---|---|---|---|---|---|---|---|
| Quadrant | DetID | PixID | Counts | Sigma | Mean | Median | Sigma |
| A | 12 | 96 | 1062638 | 1153.32 | 4251 | 4165 | 917.8 |
| A | 5 | 16 | 132465 | 139.8 | 4251 | 4165 | 917.8 |
| A | 13 | 254 | 64026 | 65.23 | 4251 | 4165 | 917.8 |
| B | 7 | 220 | 975534 | 1215.39 | 4269 | 4157 | 799.2 |
| B | 0 | 189 | 806743 | 1004.2 | 4269 | 4157 | 799.2 |
| B | 10 | 245 | 213433 | 261.85 | 4269 | 4157 | 799.2 |
| C | 9 | 221 | 150833 | 152.18 | 4118 | 4099 | 964.2 |
| C | 7 | 220 | 43085 | 40.43 | 4118 | 4099 | 964.2 |
| C | 0 | 207 | 37475 | 34.61 | 4118 | 4099 | 964.2 |
| D | 1 | 52 | 19778249 | 21074.85 | 4058 | 3917 | 938.3 |
| D | 13 | 153 | 523026 | 553.25 | 4058 | 3917 | 938.3 |
| D | 2 | 234 | 296249 | 311.56 | 4058 | 3917 | 938.3 |
Histogram calculated using DETX and DETY for each event in the final _common_clean file
| Quadrant A |  |
 |
Quadrant B |
|---|---|---|---|
| Quadrant D |  |
 |
Quadrant C |
| Plot type | Count rate plots | Images |
|---|---|---|
| Comparison with Poisson distribution Blue bars denote a histogram of data divided into 1 sec bins. Red curve is a Poisson curve with rate = median count rate of data. |
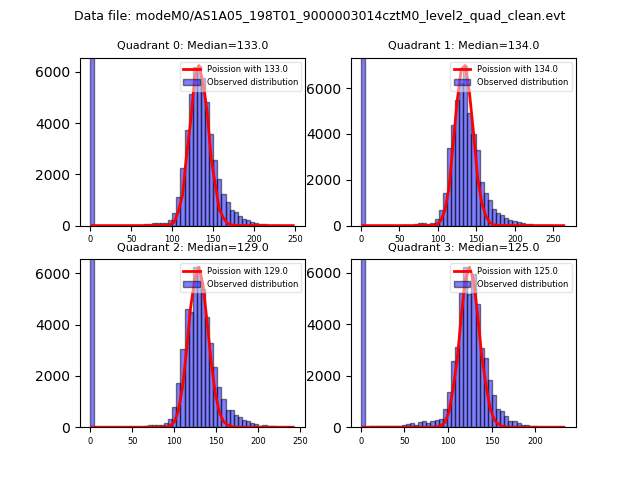 |
 |
| Quadrant-wise count rates Data is divided into 100 sec bins |
 |
|
| Module-wise count rates for Quadrant A Data is divided into 100 sec bins |
 |
 |
| Module-wise count rates for Quadrant B Data is divided into 100 sec bins |
 |
 |
| Module-wise count rates for Quadrant C Data is divided into 100 sec bins |
 |
 |
| Module-wise count rates for Quadrant D Data is divided into 100 sec bins |
 |
 |
| Parameter | Plot |
|---|---|
| CZT HV Monitor |  |
| D_VDD |  |
| Temperature 1 |  |
| Veto HV Monitor |  |
| Veto LLD | 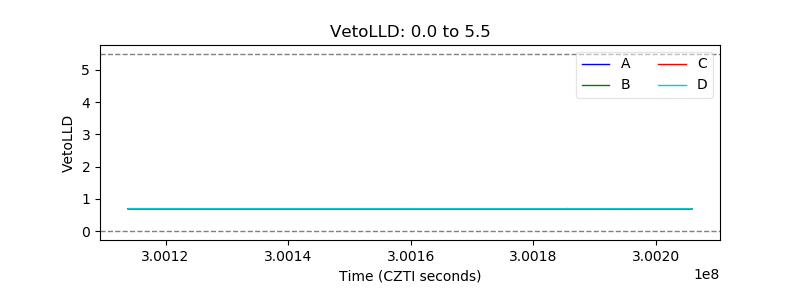 |
| Alpha Counter |  |
| _CPM_Rate |  |
| CZT Counter |  |
| +2.5 Volts monitor |  |
| +5 Volts monitor | 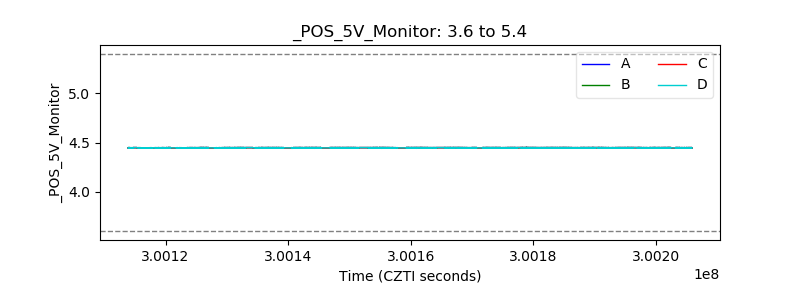 |
| _ROLL_ROT |  |
| _Roll_DEC |  |
| _Roll_RA |  |
| Veto Counter |  |