| Param | Original file | Final file |
|---|---|---|
| Filename | modeM0/AS1A05_163T01_9000003010cztM0_level2_bc.evt | modeM0/AS1A05_163T01_9000003010cztM0_level2_quad_clean.evt |
| Size (bytes) | 4,210,269,120 | 1,682,527,680 |
| Size | 3.9 GB | 1.6 GB |
| Events in quadrant A | 26,756,654 | 10,611,318 |
| Events in quadrant B | 27,813,242 | 10,764,924 |
| Events in quadrant C | 26,276,488 | 10,394,336 |
| Events in quadrant D | 37,750,623 | 10,234,000 |
| Mode SS | |||
|---|---|---|---|
| Quadrant | BADHDUFLAG | Total packets | Discarded packets |
| A | 0 | 2656 | 0 |
| B | 0 | 2656 | 0 |
| C | 0 | 2656 | 0 |
| D | 0 | 2656 | 0 |
| Mode M0 | |||
|---|---|---|---|
| Quadrant | BADHDUFLAG | Total packets | Discarded packets |
| A | 0 | 270580 | 0 |
| B | 0 | 272418 | 0 |
| C | 0 | 271557 | 0 |
| D | 0 | 303065 | 0 |
| Mode M9 | |||
|---|---|---|---|
| Quadrant | BADHDUFLAG | Total packets | Discarded packets |
| A | 0 | 202 | 0 |
| B | 0 | 202 | 0 |
| C | 0 | 202 | 0 |
| D | 0 | 202 | 0 |
| Quadrant | Total seconds | Saturated seconds | Saturation percentage |
|---|---|---|---|
| A | 130794 | 1566 | 1.197303% |
| B | 130794 | 1911 | 1.461076% |
| C | 130794 | 2254 | 1.723321% |
| D | 130794 | 3144 | 2.403780% |
Noise dominated data is calculated using 1-second bins in cleaned event files. If a bin has >2000 counts, and if more than 50% of those come from <1% of pixels, then it is considered to be noise-dominated and hence unusable.
| Quadrant | # 1 sec bins | Bins with >0 counts | Bins with >2000 counts | High rate bins dominated by noise | Noise dominated (total time) | Noise dominated (detector-on time) | Marked lightcurve |
|---|---|---|---|---|---|---|---|
| A | 150555 | 130791 | 0 | 0 | 0.00% | 0.00% | 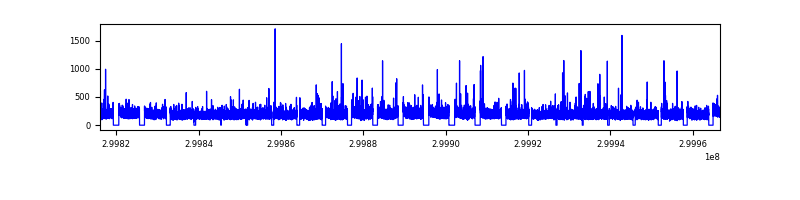 |
| B | 150555 | 130793 | 23 | 23 | 0.02% | 0.02% | 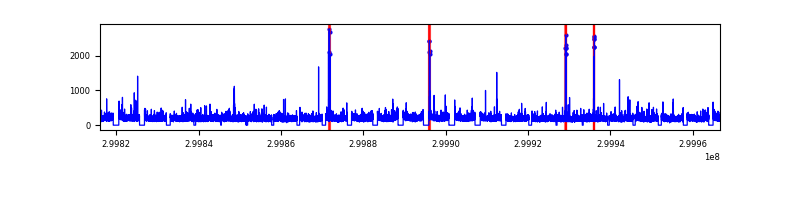 |
| C | 150555 | 130796 | 8 | 8 | 0.01% | 0.01% | 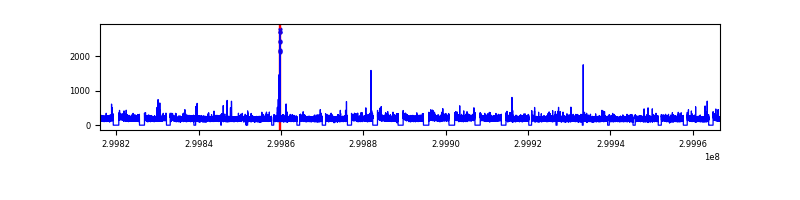 |
| D | 150555 | 130793 | 898 | 898 | 0.60% | 0.69% |  |
Top three noisy pixels from each quadrant. If the there are fewer than three noisy pixels in the level2.evt file, extra rows are filled as -1
| Pixel properties | Quadrant properties | ||||||
|---|---|---|---|---|---|---|---|
| Quadrant | DetID | PixID | Counts | Sigma | Mean | Median | Sigma |
| A | 13 | 254 | 136589 | 86.39 | 6899 | 6759 | 1502.9 |
| A | 6 | 16 | 94114 | 58.13 | 6899 | 6759 | 1502.9 |
| A | 14 | 111 | 71862 | 43.32 | 6899 | 6759 | 1502.9 |
| B | 0 | 198 | 435176 | 323.26 | 6978 | 6800 | 1325.2 |
| B | 0 | 214 | 201407 | 146.85 | 6978 | 6800 | 1325.2 |
| B | 0 | 230 | 160230 | 115.78 | 6978 | 6800 | 1325.2 |
| C | 3 | 9 | 204413 | 124.47 | 6731 | 6695 | 1588.5 |
| C | 7 | 247 | 76296 | 43.82 | 6731 | 6695 | 1588.5 |
| C | 3 | 233 | 67931 | 38.55 | 6731 | 6695 | 1588.5 |
| D | 1 | 52 | 7134864 | 4511.33 | 6838 | 6590 | 1580.1 |
| D | 7 | 238 | 2657555 | 1677.74 | 6838 | 6590 | 1580.1 |
| D | 11 | 176 | 824696 | 517.76 | 6838 | 6590 | 1580.1 |
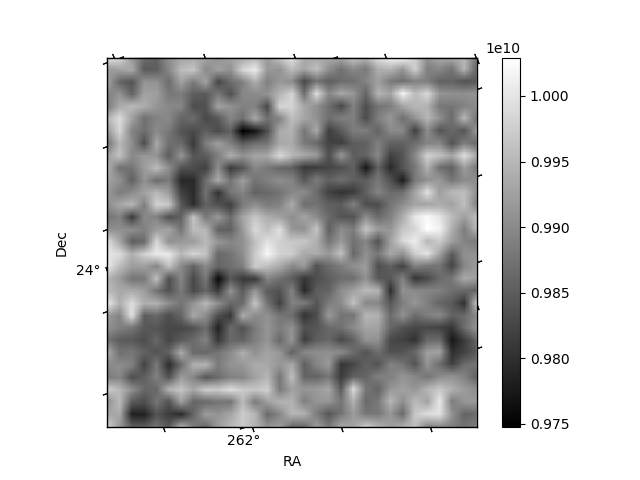
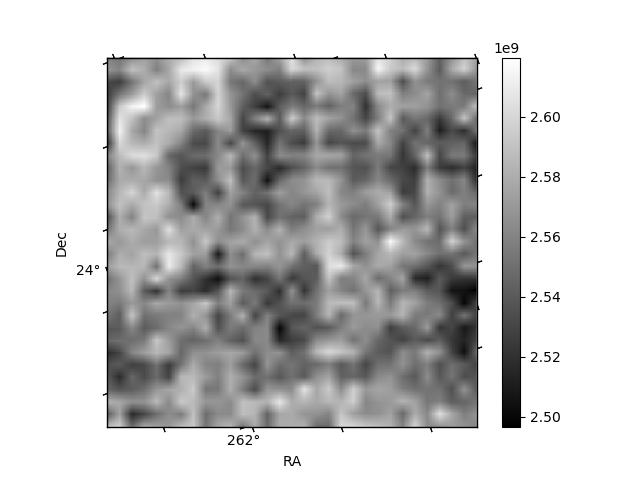
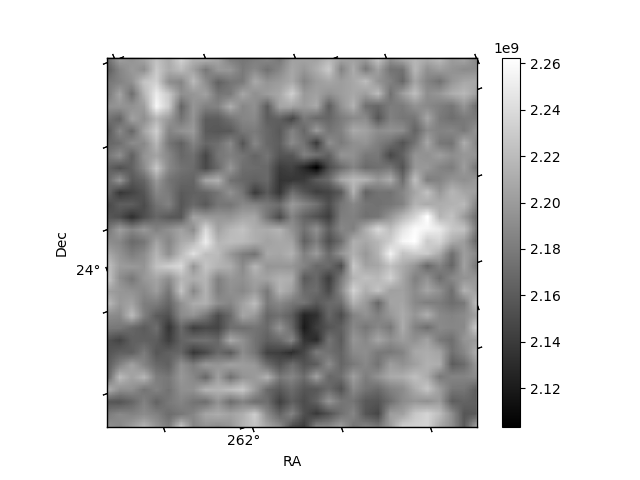
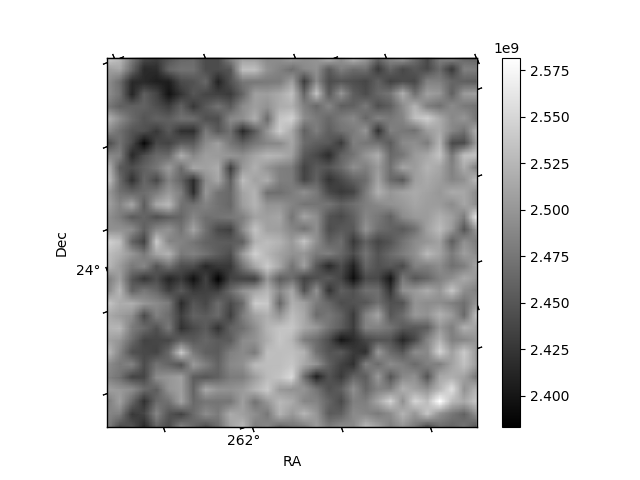
Histogram calculated using DETX and DETY for each event in the final _common_clean file
| Quadrant A |  |
 |
Quadrant B |
|---|---|---|---|
| Quadrant D |  |
 |
Quadrant C |
| Plot type | Count rate plots | Images |
|---|---|---|
| Comparison with Poisson distribution Blue bars denote a histogram of data divided into 1 sec bins. Red curve is a Poisson curve with rate = median count rate of data. |
 |
 |
| Quadrant-wise count rates Data is divided into 100 sec bins |
 |
|
| Module-wise count rates for Quadrant A Data is divided into 100 sec bins |
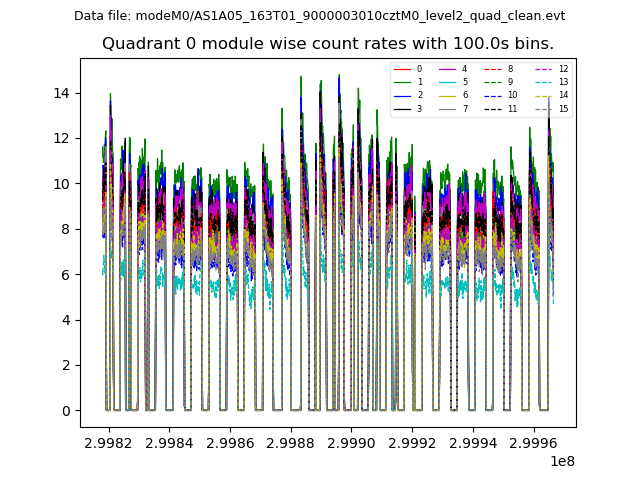 |
 |
| Module-wise count rates for Quadrant B Data is divided into 100 sec bins |
 |
 |
| Module-wise count rates for Quadrant C Data is divided into 100 sec bins |
 |
 |
| Module-wise count rates for Quadrant D Data is divided into 100 sec bins |
 |
 |
| Parameter | Plot |
|---|---|
| CZT HV Monitor | 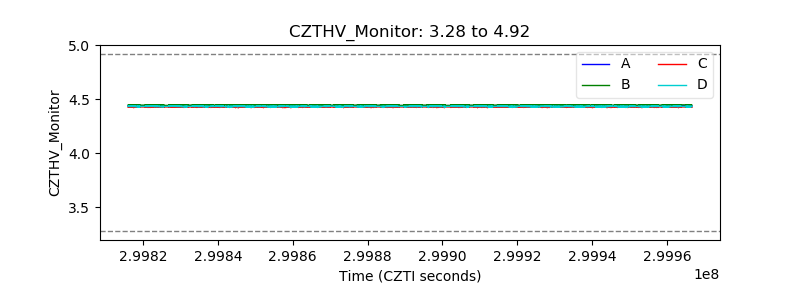 |
| D_VDD | 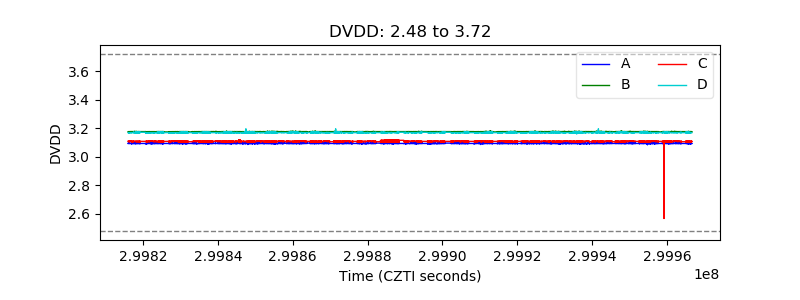 |
| Temperature 1 |  |
| Veto HV Monitor |  |
| Veto LLD |  |
| Alpha Counter |  |
| _CPM_Rate |  |
| CZT Counter |  |
| +2.5 Volts monitor |  |
| +5 Volts monitor |  |
| _ROLL_ROT |  |
| _Roll_DEC |  |
| _Roll_RA |  |
| Veto Counter |  |