| Param | Original file | Final file |
|---|---|---|
| Filename | modeM0/AS1A06_009T02_9000003006cztM0_level2_bc.evt | modeM0/AS1A06_009T02_9000003006cztM0_level2_quad_clean.evt |
| Size (bytes) | 609,537,600 | 183,539,520 |
| Size | 581.3 MB | 175.0 MB |
| Events in quadrant A | 3,740,245 | 1,148,890 |
| Events in quadrant B | 4,374,185 | 1,155,355 |
| Events in quadrant C | 3,439,935 | 1,138,905 |
| Events in quadrant D | 5,859,219 | 1,061,649 |
| Mode M0 | |||
|---|---|---|---|
| Quadrant | BADHDUFLAG | Total packets | Discarded packets |
| A | 0 | 32431 | 0 |
| B | 0 | 35119 | 0 |
| C | 0 | 32004 | 0 |
| D | 0 | 41249 | 0 |
| Mode M9 | |||
|---|---|---|---|
| Quadrant | BADHDUFLAG | Total packets | Discarded packets |
| A | 0 | 40 | 0 |
| B | 0 | 40 | 0 |
| C | 0 | 40 | 0 |
| D | 0 | 40 | 0 |
| Mode SS | |||
|---|---|---|---|
| Quadrant | BADHDUFLAG | Total packets | Discarded packets |
| A | 0 | 312 | 0 |
| B | 0 | 312 | 0 |
| C | 0 | 312 | 0 |
| D | 0 | 312 | 0 |
| Quadrant | Total seconds | Saturated seconds | Saturation percentage |
|---|---|---|---|
| A | 15268 | 111 | 0.727011% |
| B | 15268 | 465 | 3.045586% |
| C | 15268 | 135 | 0.884202% |
| D | 15268 | 718 | 4.702646% |
Noise dominated data is calculated using 1-second bins in cleaned event files. If a bin has >2000 counts, and if more than 50% of those come from <1% of pixels, then it is considered to be noise-dominated and hence unusable.
| Quadrant | # 1 sec bins | Bins with >0 counts | Bins with >2000 counts | High rate bins dominated by noise | Noise dominated (total time) | Noise dominated (detector-on time) | Marked lightcurve |
|---|---|---|---|---|---|---|---|
| A | 19238 | 15268 | 15 | 15 | 0.08% | 0.10% | 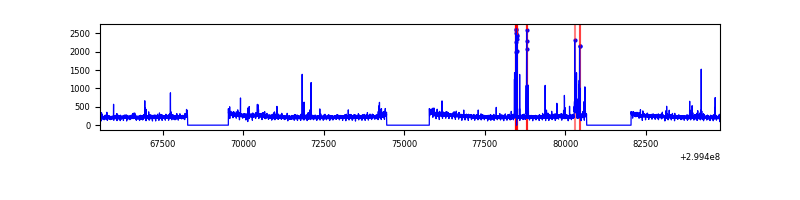 |
| B | 19238 | 15267 | 112 | 112 | 0.58% | 0.73% | 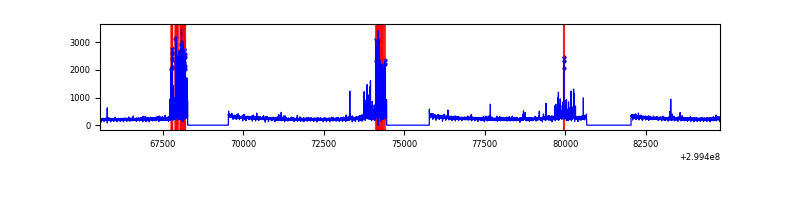 |
| C | 19238 | 15268 | 0 | 0 | 0.00% | 0.00% |  |
| D | 19238 | 15268 | 138 | 138 | 0.72% | 0.90% | 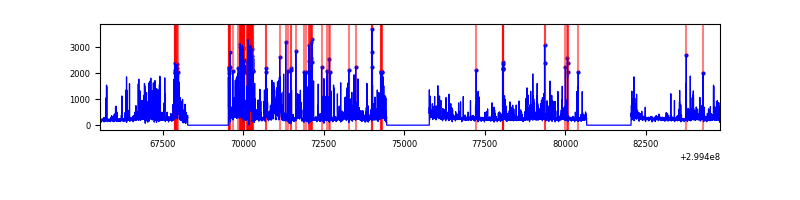 |
Top three noisy pixels from each quadrant. If the there are fewer than three noisy pixels in the level2.evt file, extra rows are filled as -1
| Pixel properties | Quadrant properties | ||||||
|---|---|---|---|---|---|---|---|
| Quadrant | DetID | PixID | Counts | Sigma | Mean | Median | Sigma |
| A | 4 | 2 | 142328 | 734.4 | 895 | 881 | 192.6 |
| A | 8 | 205 | 63065 | 322.86 | 895 | 881 | 192.6 |
| A | 14 | 238 | 51763 | 264.18 | 895 | 881 | 192.6 |
| B | 4 | 142 | 601157 | 3573.65 | 910 | 893 | 168.0 |
| B | 7 | 220 | 168376 | 997.1 | 910 | 893 | 168.0 |
| B | 0 | 198 | 31150 | 180.13 | 910 | 893 | 168.0 |
| C | 3 | 233 | 38553 | 184.95 | 882 | 883 | 203.7 |
| C | 13 | 61 | 5193 | 21.16 | 882 | 883 | 203.7 |
| C | 3 | 9 | 4625 | 18.37 | 882 | 883 | 203.7 |
| D | 1 | 52 | 2457616 | 12505.96 | 868 | 841 | 196.4 |
| D | 2 | 234 | 73946 | 372.13 | 868 | 841 | 196.4 |
| D | 2 | 120 | 18950 | 92.18 | 868 | 841 | 196.4 |
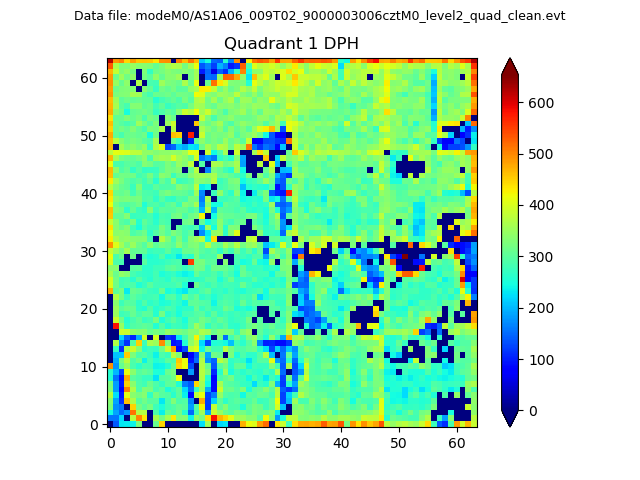
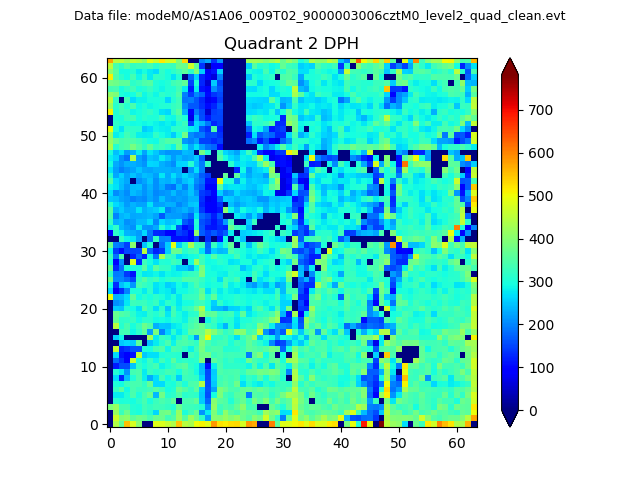
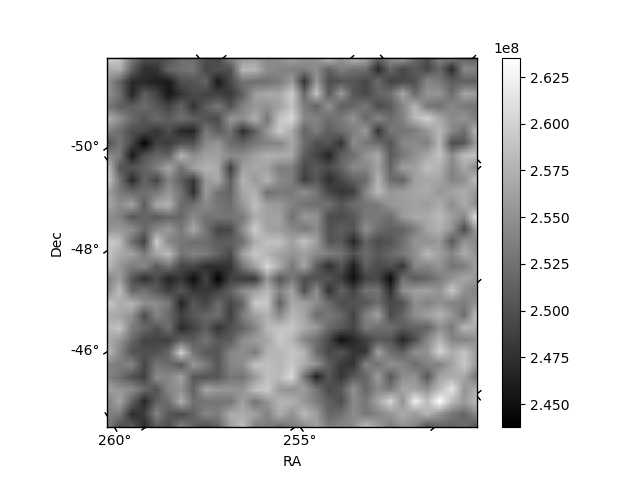
Histogram calculated using DETX and DETY for each event in the final _common_clean file
| Quadrant A | 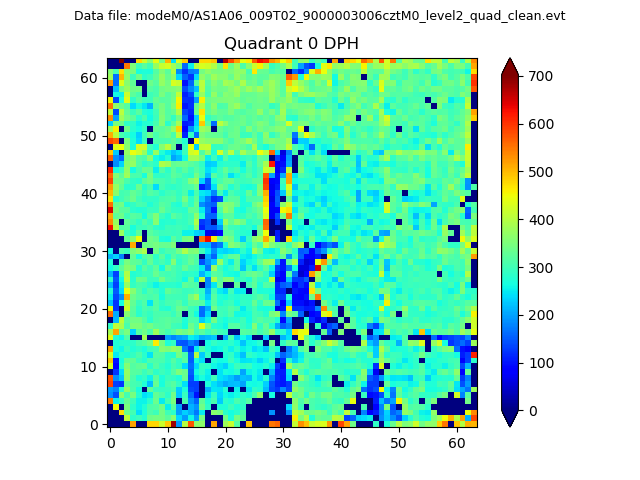 |
 |
Quadrant B |
|---|---|---|---|
| Quadrant D |  |
 |
Quadrant C |
| Plot type | Count rate plots | Images |
|---|---|---|
| Comparison with Poisson distribution Blue bars denote a histogram of data divided into 1 sec bins. Red curve is a Poisson curve with rate = median count rate of data. |
 |
 |
| Quadrant-wise count rates Data is divided into 100 sec bins |
 |
|
| Module-wise count rates for Quadrant A Data is divided into 100 sec bins |
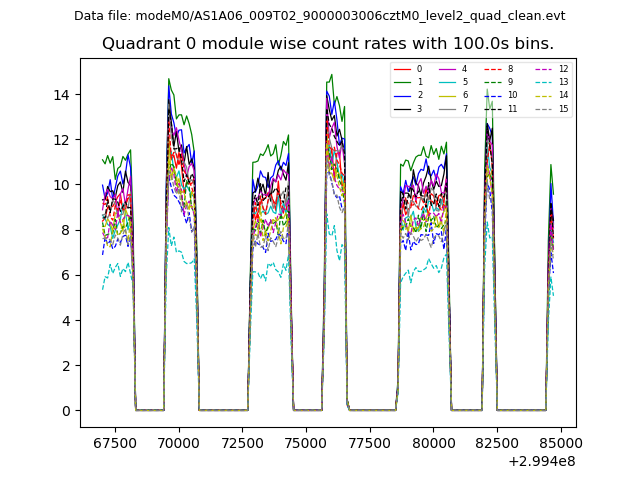 |
 |
| Module-wise count rates for Quadrant B Data is divided into 100 sec bins |
 |
 |
| Module-wise count rates for Quadrant C Data is divided into 100 sec bins |
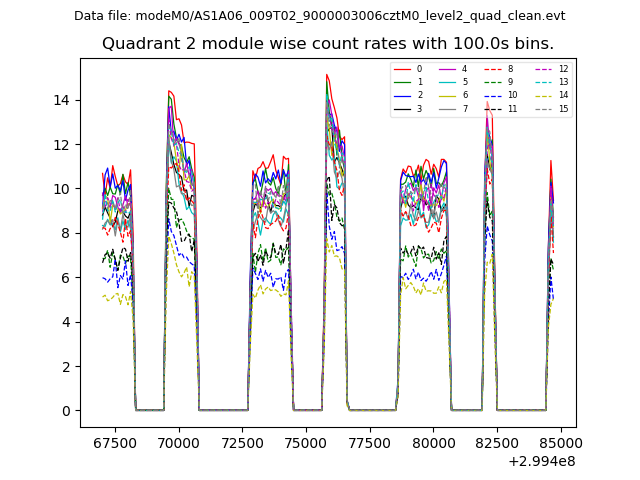 |
 |
| Module-wise count rates for Quadrant D Data is divided into 100 sec bins |
 |
 |
| Parameter | Plot |
|---|---|
| CZT HV Monitor | 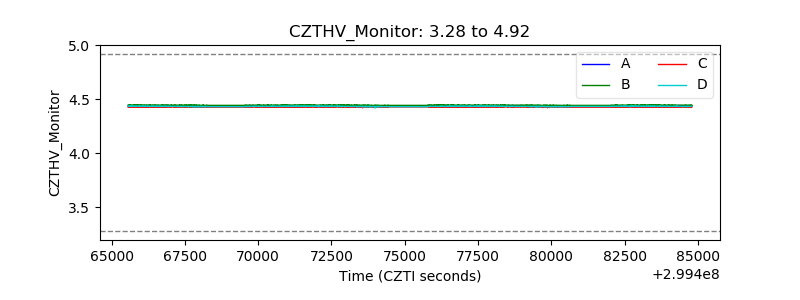 |
| D_VDD | 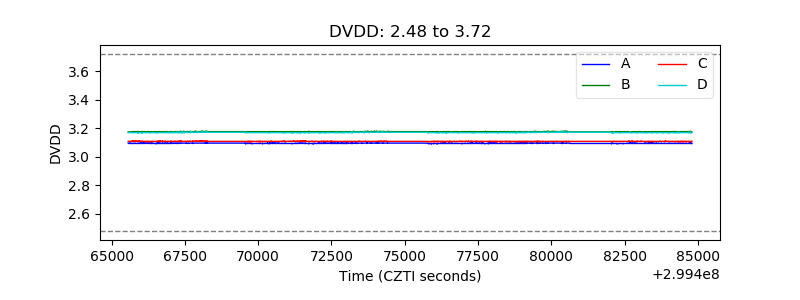 |
| Temperature 1 |  |
| Veto HV Monitor |  |
| Veto LLD |  |
| Alpha Counter |  |
| _CPM_Rate |  |
| CZT Counter |  |
| +2.5 Volts monitor |  |
| +5 Volts monitor |  |
| _ROLL_ROT |  |
| _Roll_DEC |  |
| _Roll_RA |  |
| Veto Counter |  |