| Param | Original file | Final file |
|---|---|---|
| Filename | modeM0/AS1A05_174T01_9000003008cztM0_level2_bc.evt | modeM0/AS1A05_174T01_9000003008cztM0_level2_quad_clean.evt |
| Size (bytes) | 10,308,513,600 | 3,595,357,440 |
| Size | 9.6 GB | 3.3 GB |
| Events in quadrant A | 61,064,338 | 22,958,046 |
| Events in quadrant B | 67,206,183 | 23,424,193 |
| Events in quadrant C | 73,091,558 | 22,506,126 |
| Events in quadrant D | 92,771,125 | 21,835,846 |
| Mode M9 | |||
|---|---|---|---|
| Quadrant | BADHDUFLAG | Total packets | Discarded packets |
| A | 0 | 444 | 0 |
| B | 0 | 446 | 0 |
| C | 0 | 446 | 0 |
| D | 0 | 446 | 0 |
| Mode M0 | |||
|---|---|---|---|
| Quadrant | BADHDUFLAG | Total packets | Discarded packets |
| A | 0 | 570196 | 0 |
| B | 0 | 596605 | 0 |
| C | 0 | 611171 | 0 |
| D | 0 | 687384 | 0 |
| Mode SS | |||
|---|---|---|---|
| Quadrant | BADHDUFLAG | Total packets | Discarded packets |
| A | 0 | 5404 | 0 |
| B | 0 | 5404 | 0 |
| C | 0 | 5404 | 0 |
| D | 0 | 5404 | 0 |
| Quadrant | Total seconds | Saturated seconds | Saturation percentage |
|---|---|---|---|
| A | 265454 | 4761 | 1.793531% |
| B | 265455 | 7520 | 2.832872% |
| C | 265455 | 7297 | 2.748865% |
| D | 265455 | 12801 | 4.822286% |
Noise dominated data is calculated using 1-second bins in cleaned event files. If a bin has >2000 counts, and if more than 50% of those come from <1% of pixels, then it is considered to be noise-dominated and hence unusable.
| Quadrant | # 1 sec bins | Bins with >0 counts | Bins with >2000 counts | High rate bins dominated by noise | Noise dominated (total time) | Noise dominated (detector-on time) | Marked lightcurve |
|---|---|---|---|---|---|---|---|
| A | 328867 | 265466 | 125 | 125 | 0.04% | 0.05% |  |
| B | 328867 | 265460 | 674 | 674 | 0.20% | 0.25% | 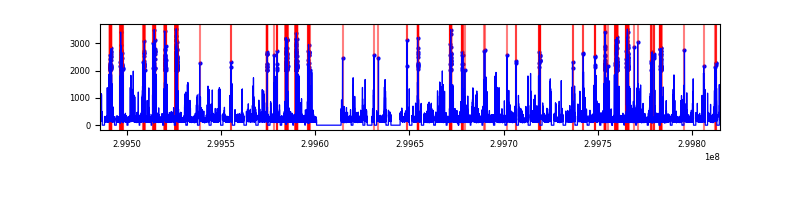 |
| C | 328867 | 265465 | 565 | 565 | 0.17% | 0.21% |  |
| D | 328867 | 265448 | 2244 | 2244 | 0.68% | 0.85% |  |
Top three noisy pixels from each quadrant. If the there are fewer than three noisy pixels in the level2.evt file, extra rows are filled as -1
| Pixel properties | Quadrant properties | ||||||
|---|---|---|---|---|---|---|---|
| Quadrant | DetID | PixID | Counts | Sigma | Mean | Median | Sigma |
| A | 14 | 238 | 2980902 | 975.89 | 14077 | 13816 | 3040.4 |
| A | 4 | 2 | 1170306 | 380.38 | 14077 | 13816 | 3040.4 |
| A | 8 | 205 | 993404 | 322.19 | 14077 | 13816 | 3040.4 |
| B | 4 | 142 | 5528913 | 2068.87 | 14171 | 13808 | 2665.8 |
| B | 7 | 220 | 2788045 | 1040.7 | 14171 | 13808 | 2665.8 |
| B | 0 | 197 | 1254060 | 465.25 | 14171 | 13808 | 2665.8 |
| C | 3 | 9 | 18352685 | 5666.91 | 13760 | 13687 | 3236.2 |
| C | 3 | 233 | 911605 | 277.46 | 13760 | 13687 | 3236.2 |
| C | 0 | 207 | 408616 | 122.04 | 13760 | 13687 | 3236.2 |
| D | 1 | 52 | 32409344 | 10025.97 | 13896 | 13416 | 3231.2 |
| D | 5 | 222 | 3050808 | 940.02 | 13896 | 13416 | 3231.2 |
| D | 2 | 234 | 1184458 | 362.42 | 13896 | 13416 | 3231.2 |
Histogram calculated using DETX and DETY for each event in the final _common_clean file
| Quadrant A | 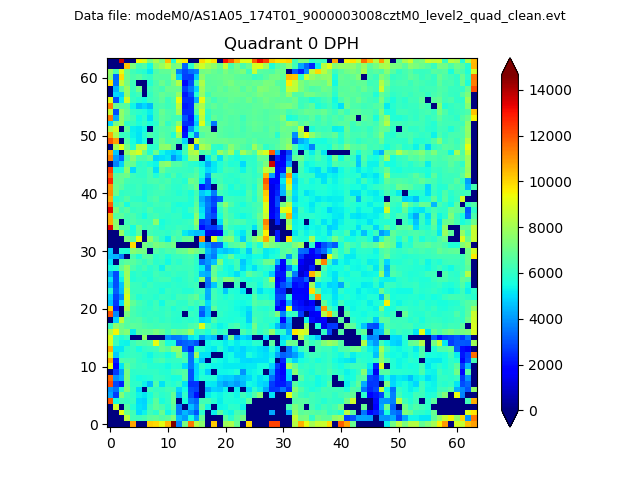 |
 |
Quadrant B |
|---|---|---|---|
| Quadrant D |  |
 |
Quadrant C |
| Plot type | Count rate plots | Images |
|---|---|---|
| Comparison with Poisson distribution Blue bars denote a histogram of data divided into 1 sec bins. Red curve is a Poisson curve with rate = median count rate of data. |
 |
 |
| Quadrant-wise count rates Data is divided into 100 sec bins |
 |
|
| Module-wise count rates for Quadrant A Data is divided into 100 sec bins |
 |
 |
| Module-wise count rates for Quadrant B Data is divided into 100 sec bins |
 |
 |
| Module-wise count rates for Quadrant C Data is divided into 100 sec bins |
 |
 |
| Module-wise count rates for Quadrant D Data is divided into 100 sec bins |
 |
 |
| Parameter | Plot |
|---|---|
| CZT HV Monitor |  |
| D_VDD |  |
| Temperature 1 |  |
| Veto HV Monitor | 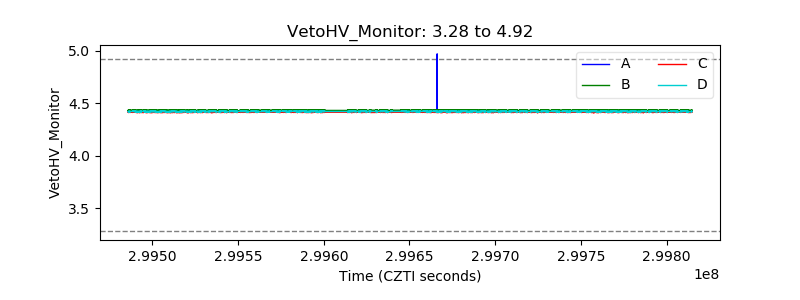 |
| Veto LLD |  |
| Alpha Counter |  |
| _CPM_Rate |  |
| CZT Counter | 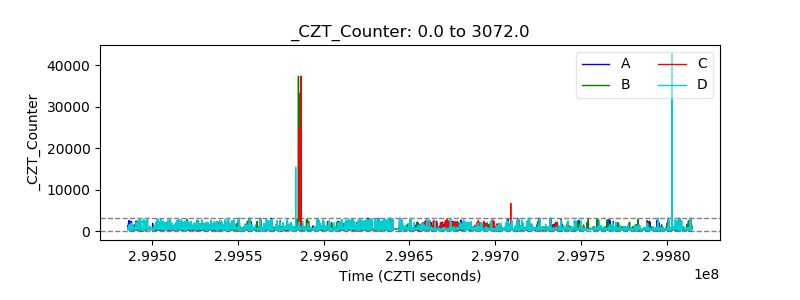 |
| +2.5 Volts monitor |  |
| +5 Volts monitor |  |
| _ROLL_ROT |  |
| _Roll_DEC |  |
| _Roll_RA | 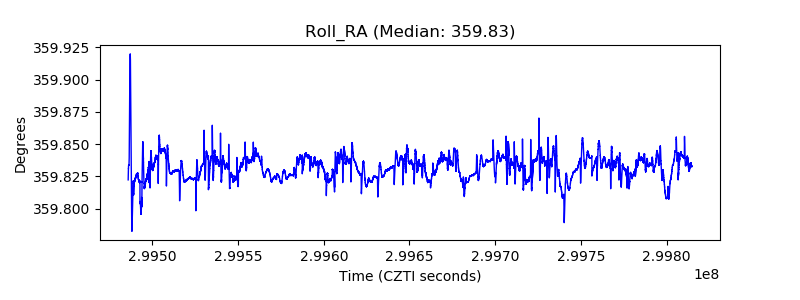 |
| Veto Counter |  |