| Param | Original file | Final file |
|---|---|---|
| Filename | modeM0/AS1A05_117T01_9000003002cztM0_level2_bc.evt | modeM0/AS1A05_117T01_9000003002cztM0_level2_quad_clean.evt |
| Size (bytes) | 2,272,469,760 | 777,576,960 |
| Size | 2.1 GB | 741.6 MB |
| Events in quadrant A | 14,167,683 | 5,000,233 |
| Events in quadrant B | 15,018,242 | 5,018,685 |
| Events in quadrant C | 12,864,932 | 4,817,583 |
| Events in quadrant D | 22,806,747 | 4,725,463 |
| Mode SS | |||
|---|---|---|---|
| Quadrant | BADHDUFLAG | Total packets | Discarded packets |
| A | 0 | 1182 | 0 |
| B | 0 | 1182 | 0 |
| C | 0 | 1182 | 0 |
| D | 0 | 1182 | 0 |
| Mode M9 | |||
|---|---|---|---|
| Quadrant | BADHDUFLAG | Total packets | Discarded packets |
| A | 0 | 86 | 0 |
| B | 0 | 86 | 0 |
| C | 0 | 86 | 0 |
| D | 0 | 86 | 0 |
| Mode M0 | |||
|---|---|---|---|
| Quadrant | BADHDUFLAG | Total packets | Discarded packets |
| A | 0 | 129778 | 0 |
| B | 0 | 131861 | 0 |
| C | 0 | 123802 | 0 |
| D | 0 | 155629 | 0 |
| Quadrant | Total seconds | Saturated seconds | Saturation percentage |
|---|---|---|---|
| A | 58176 | 1577 | 2.710740% |
| B | 58176 | 1503 | 2.583540% |
| C | 58176 | 939 | 1.614068% |
| D | 58176 | 2533 | 4.354029% |
Noise dominated data is calculated using 1-second bins in cleaned event files. If a bin has >2000 counts, and if more than 50% of those come from <1% of pixels, then it is considered to be noise-dominated and hence unusable.
| Quadrant | # 1 sec bins | Bins with >0 counts | Bins with >2000 counts | High rate bins dominated by noise | Noise dominated (total time) | Noise dominated (detector-on time) | Marked lightcurve |
|---|---|---|---|---|---|---|---|
| A | 65760 | 58175 | 39 | 39 | 0.06% | 0.07% |  |
| B | 65761 | 58178 | 98 | 98 | 0.15% | 0.17% | 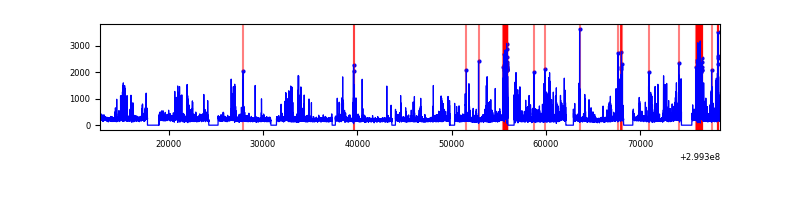 |
| C | 65760 | 58176 | 1 | 1 | 0.00% | 0.00% | 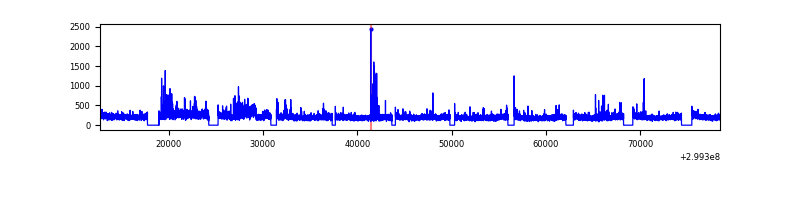 |
| D | 65761 | 58176 | 641 | 641 | 0.97% | 1.10% |  |
Top three noisy pixels from each quadrant. If the there are fewer than three noisy pixels in the level2.evt file, extra rows are filled as -1
| Pixel properties | Quadrant properties | ||||||
|---|---|---|---|---|---|---|---|
| Quadrant | DetID | PixID | Counts | Sigma | Mean | Median | Sigma |
| A | 14 | 238 | 1067225 | 1577.67 | 3087 | 3033 | 674.5 |
| A | 12 | 96 | 427047 | 628.6 | 3087 | 3033 | 674.5 |
| A | 4 | 2 | 373885 | 549.79 | 3087 | 3033 | 674.5 |
| B | 0 | 85 | 1008277 | 1697.06 | 3082 | 3001 | 592.4 |
| B | 7 | 220 | 875195 | 1472.4 | 3082 | 3001 | 592.4 |
| B | 4 | 142 | 243794 | 406.49 | 3082 | 3001 | 592.4 |
| C | 3 | 9 | 917262 | 1299.66 | 2975 | 2958 | 703.5 |
| C | 3 | 233 | 332581 | 468.55 | 2975 | 2958 | 703.5 |
| C | 9 | 54 | 117338 | 162.59 | 2975 | 2958 | 703.5 |
| D | 1 | 52 | 4884674 | 6968.87 | 3023 | 2922 | 700.5 |
| D | 7 | 238 | 3068020 | 4375.53 | 3023 | 2922 | 700.5 |
| D | 2 | 16 | 1799584 | 2564.8 | 3023 | 2922 | 700.5 |
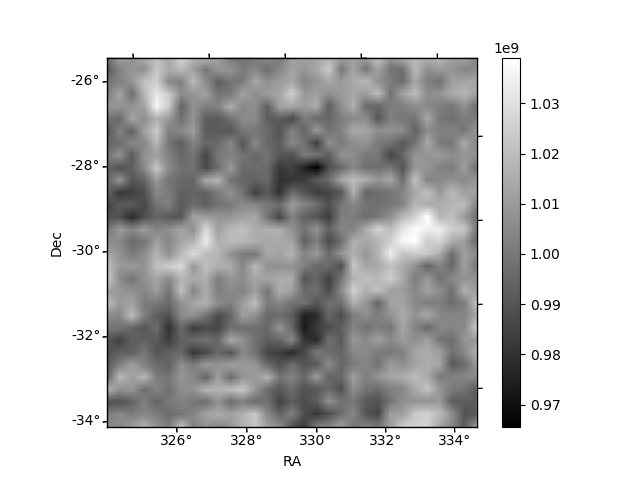
Histogram calculated using DETX and DETY for each event in the final _common_clean file
| Quadrant A |  |
 |
Quadrant B |
|---|---|---|---|
| Quadrant D |  |
 |
Quadrant C |
| Plot type | Count rate plots | Images |
|---|---|---|
| Comparison with Poisson distribution Blue bars denote a histogram of data divided into 1 sec bins. Red curve is a Poisson curve with rate = median count rate of data. |
 |
 |
| Quadrant-wise count rates Data is divided into 100 sec bins |
 |
|
| Module-wise count rates for Quadrant A Data is divided into 100 sec bins |
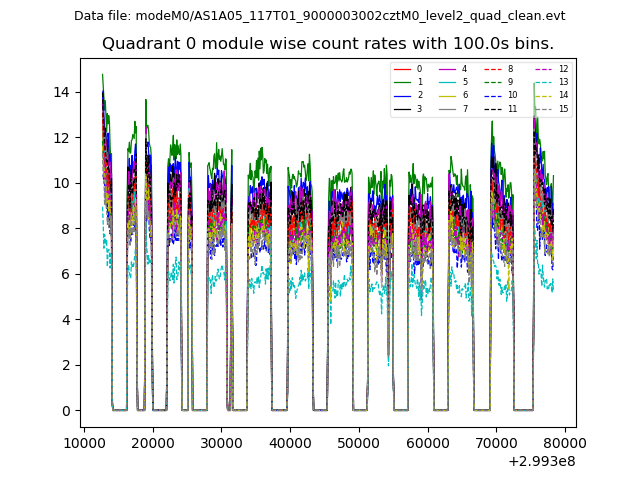 |
 |
| Module-wise count rates for Quadrant B Data is divided into 100 sec bins |
 |
 |
| Module-wise count rates for Quadrant C Data is divided into 100 sec bins |
 |
 |
| Module-wise count rates for Quadrant D Data is divided into 100 sec bins |
 |
 |
| Parameter | Plot |
|---|---|
| CZT HV Monitor | 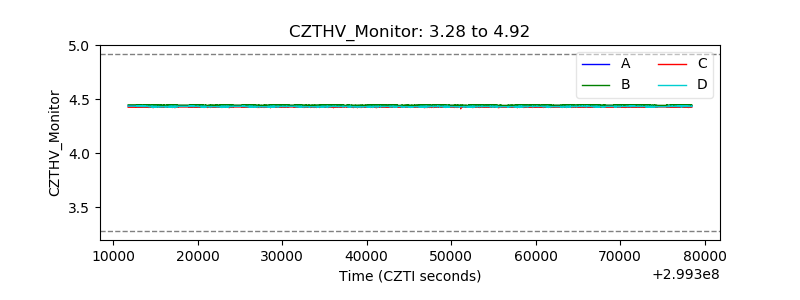 |
| D_VDD |  |
| Temperature 1 |  |
| Veto HV Monitor |  |
| Veto LLD |  |
| Alpha Counter |  |
| _CPM_Rate |  |
| CZT Counter |  |
| +2.5 Volts monitor |  |
| +5 Volts monitor | 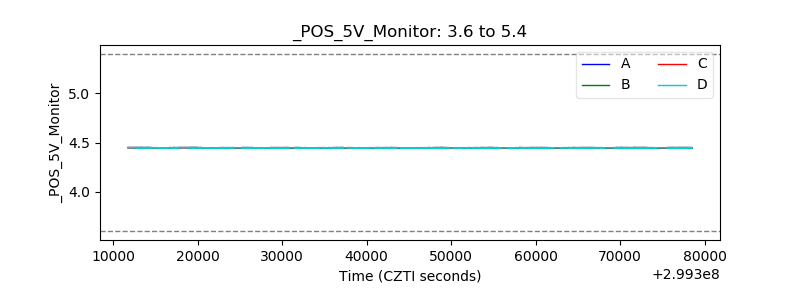 |
| _ROLL_ROT | 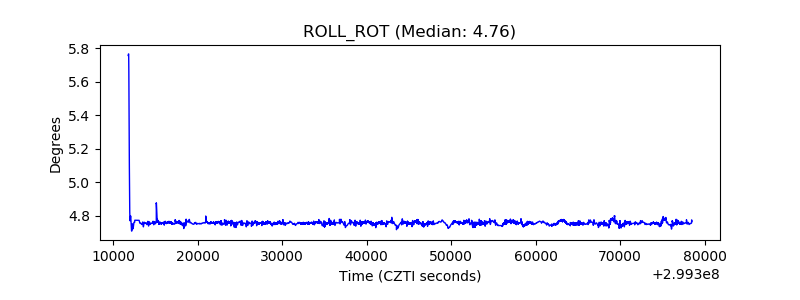 |
| _Roll_DEC | 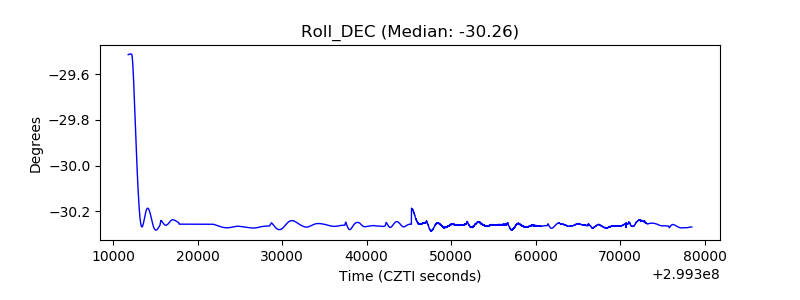 |
| _Roll_RA |  |
| Veto Counter |  |