| Param | Original file | Final file |
|---|---|---|
| Filename | modeM0/AS1T03_123T01_9000003000cztM0_level2_bc.evt | modeM0/AS1T03_123T01_9000003000cztM0_level2_quad_clean.evt |
| Size (bytes) | 3,099,159,360 | 1,093,345,920 |
| Size | 2.9 GB | 1.0 GB |
| Events in quadrant A | 18,762,625 | 6,984,772 |
| Events in quadrant B | 19,543,724 | 7,075,180 |
| Events in quadrant C | 18,086,647 | 6,644,681 |
| Events in quadrant D | 31,620,394 | 6,531,102 |
| Mode M9 | |||
|---|---|---|---|
| Quadrant | BADHDUFLAG | Total packets | Discarded packets |
| A | 0 | 149 | 0 |
| B | 0 | 149 | 0 |
| C | 0 | 149 | 0 |
| D | 0 | 149 | 0 |
| Mode SS | |||
|---|---|---|---|
| Quadrant | BADHDUFLAG | Total packets | Discarded packets |
| A | 0 | 1748 | 0 |
| B | 0 | 1748 | 0 |
| C | 0 | 1748 | 0 |
| D | 0 | 1748 | 0 |
| Mode M0 | |||
|---|---|---|---|
| Quadrant | BADHDUFLAG | Total packets | Discarded packets |
| A | 0 | 179315 | 0 |
| B | 0 | 182151 | 0 |
| C | 0 | 179677 | 0 |
| D | 0 | 220376 | 0 |
| Quadrant | Total seconds | Saturated seconds | Saturation percentage |
|---|---|---|---|
| A | 85795 | 1120 | 1.305437% |
| B | 85795 | 1367 | 1.593333% |
| C | 85795 | 1586 | 1.848593% |
| D | 85795 | 3207 | 3.737980% |
Noise dominated data is calculated using 1-second bins in cleaned event files. If a bin has >2000 counts, and if more than 50% of those come from <1% of pixels, then it is considered to be noise-dominated and hence unusable.
| Quadrant | # 1 sec bins | Bins with >0 counts | Bins with >2000 counts | High rate bins dominated by noise | Noise dominated (total time) | Noise dominated (detector-on time) | Marked lightcurve |
|---|---|---|---|---|---|---|---|
| A | 100640 | 85797 | 25 | 25 | 0.02% | 0.03% |  |
| B | 100640 | 85798 | 1 | 1 | 0.00% | 0.00% |  |
| C | 100640 | 85798 | 5 | 5 | 0.00% | 0.01% | 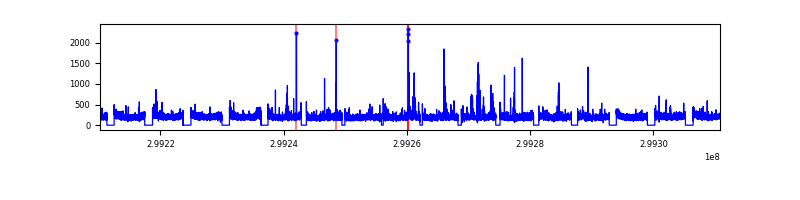 |
| D | 100640 | 85795 | 1010 | 1010 | 1.00% | 1.18% |  |
Top three noisy pixels from each quadrant. If the there are fewer than three noisy pixels in the level2.evt file, extra rows are filled as -1
| Pixel properties | Quadrant properties | ||||||
|---|---|---|---|---|---|---|---|
| Quadrant | DetID | PixID | Counts | Sigma | Mean | Median | Sigma |
| A | 4 | 2 | 257214 | 246.67 | 4750 | 4668 | 1023.8 |
| A | 10 | 253 | 120540 | 113.18 | 4750 | 4668 | 1023.8 |
| A | 13 | 254 | 66422 | 60.32 | 4750 | 4668 | 1023.8 |
| B | 10 | 245 | 832464 | 928.33 | 4779 | 4671 | 891.7 |
| B | 0 | 230 | 156709 | 170.5 | 4779 | 4671 | 891.7 |
| B | 0 | 214 | 140152 | 151.94 | 4779 | 4671 | 891.7 |
| C | 3 | 233 | 349066 | 330.35 | 4501 | 4482 | 1043.1 |
| C | 9 | 54 | 309506 | 292.42 | 4501 | 4482 | 1043.1 |
| C | 3 | 9 | 51812 | 45.37 | 4501 | 4482 | 1043.1 |
| D | 1 | 52 | 9629445 | 9130.2 | 4603 | 4452 | 1054.2 |
| D | 7 | 238 | 2799169 | 2651.05 | 4603 | 4452 | 1054.2 |
| D | 11 | 176 | 697747 | 657.65 | 4603 | 4452 | 1054.2 |
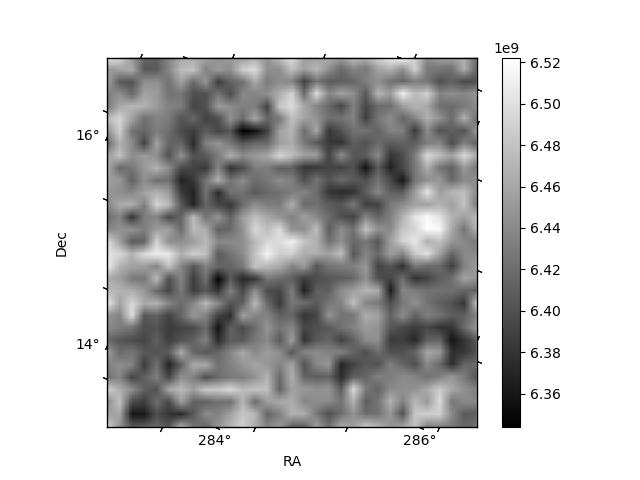
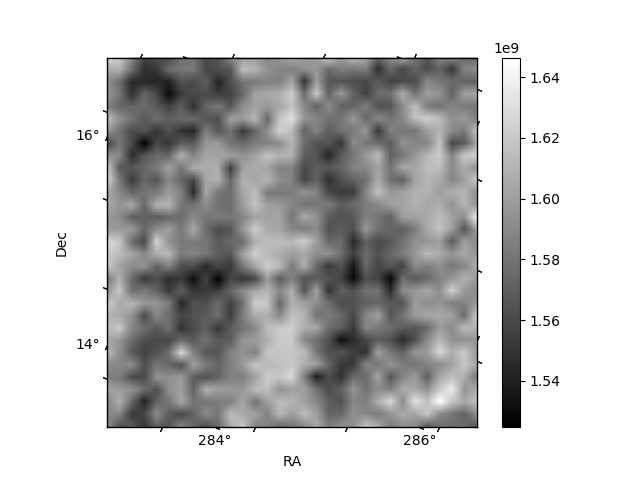
Histogram calculated using DETX and DETY for each event in the final _common_clean file
| Quadrant A |  |
 |
Quadrant B |
|---|---|---|---|
| Quadrant D |  |
 |
Quadrant C |
| Plot type | Count rate plots | Images |
|---|---|---|
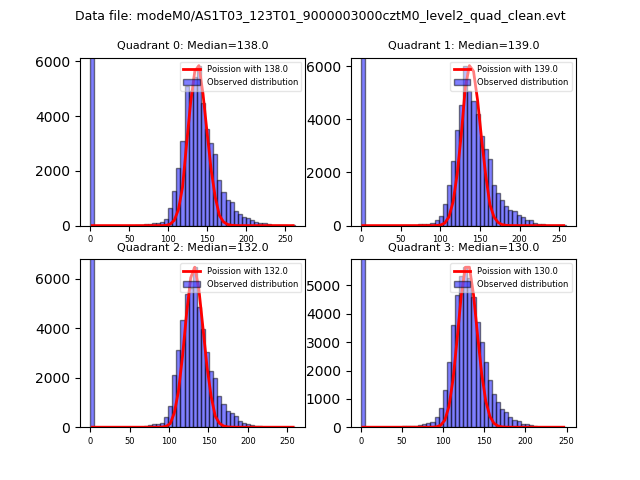
| Comparison with Poisson distribution Blue bars denote a histogram of data divided into 1 sec bins. Red curve is a Poisson curve with rate = median count rate of data. |
 |
 |
| Quadrant-wise count rates Data is divided into 100 sec bins |
 |
|
| Module-wise count rates for Quadrant A Data is divided into 100 sec bins |
 |
 |
| Module-wise count rates for Quadrant B Data is divided into 100 sec bins |
 |
 |
| Module-wise count rates for Quadrant C Data is divided into 100 sec bins |
 |
 |
| Module-wise count rates for Quadrant D Data is divided into 100 sec bins |
 |
 |
| Parameter | Plot |
|---|---|
| CZT HV Monitor |  |
| D_VDD |  |
| Temperature 1 | 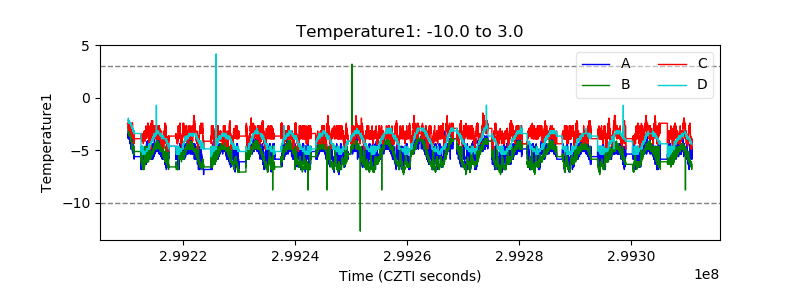 |
| Veto HV Monitor | 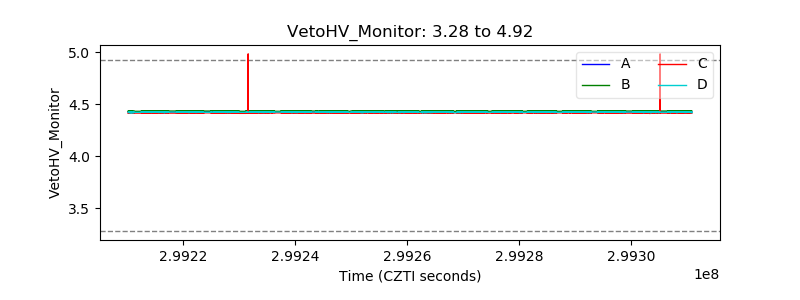 |
| Veto LLD |  |
| Alpha Counter | 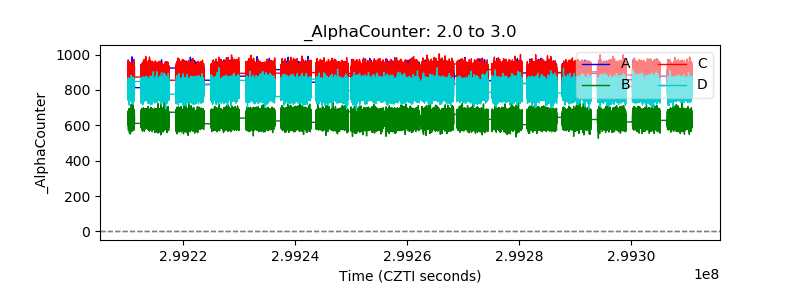 |
| _CPM_Rate |  |
| CZT Counter |  |
| +2.5 Volts monitor |  |
| +5 Volts monitor |  |
| _ROLL_ROT |  |
| _Roll_DEC | 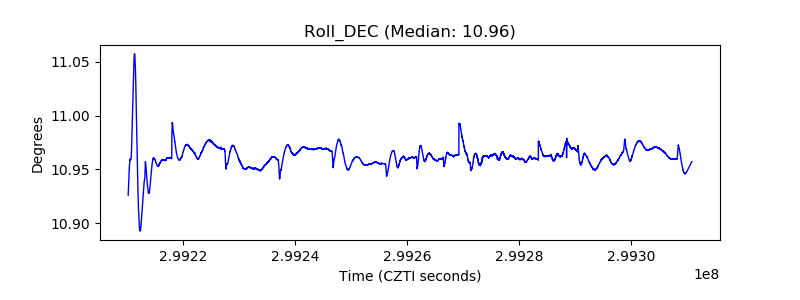 |
| _Roll_RA |  |
| Veto Counter |  |