| Param | Original file | Final file |
|---|---|---|
| Filename | modeM0/AS1A06_005T02_9000002996cztM0_level2_bc.evt | modeM0/AS1A06_005T02_9000002996cztM0_level2_quad_clean.evt |
| Size (bytes) | 2,387,609,280 | 880,018,560 |
| Size | 2.2 GB | 839.3 MB |
| Events in quadrant A | 15,594,338 | 5,664,729 |
| Events in quadrant B | 16,966,804 | 5,672,422 |
| Events in quadrant C | 14,483,274 | 5,373,894 |
| Events in quadrant D | 20,578,184 | 5,229,768 |
| Mode M0 | |||
|---|---|---|---|
| Quadrant | BADHDUFLAG | Total packets | Discarded packets |
| A | 0 | 145162 | 0 |
| B | 0 | 151518 | 0 |
| C | 0 | 143644 | 0 |
| D | 0 | 161768 | 0 |
| Mode SS | |||
|---|---|---|---|
| Quadrant | BADHDUFLAG | Total packets | Discarded packets |
| A | 0 | 1396 | 0 |
| B | 0 | 1396 | 0 |
| C | 0 | 1396 | 0 |
| D | 0 | 1396 | 0 |
| Mode M9 | |||
|---|---|---|---|
| Quadrant | BADHDUFLAG | Total packets | Discarded packets |
| A | 0 | 121 | 0 |
| B | 0 | 121 | 0 |
| C | 0 | 121 | 0 |
| D | 0 | 121 | 0 |
| Quadrant | Total seconds | Saturated seconds | Saturation percentage |
|---|---|---|---|
| A | 68769 | 893 | 1.298550% |
| B | 68769 | 1110 | 1.614099% |
| C | 68769 | 1022 | 1.486135% |
| D | 68769 | 1575 | 2.290276% |
Noise dominated data is calculated using 1-second bins in cleaned event files. If a bin has >2000 counts, and if more than 50% of those come from <1% of pixels, then it is considered to be noise-dominated and hence unusable.
| Quadrant | # 1 sec bins | Bins with >0 counts | Bins with >2000 counts | High rate bins dominated by noise | Noise dominated (total time) | Noise dominated (detector-on time) | Marked lightcurve |
|---|---|---|---|---|---|---|---|
| A | 80629 | 68772 | 58 | 58 | 0.07% | 0.08% |  |
| B | 80629 | 68769 | 12 | 12 | 0.01% | 0.02% |  |
| C | 80629 | 68771 | 0 | 0 | 0.00% | 0.00% |  |
| D | 80629 | 68768 | 347 | 347 | 0.43% | 0.50% |  |
Top three noisy pixels from each quadrant. If the there are fewer than three noisy pixels in the level2.evt file, extra rows are filled as -1
| Pixel properties | Quadrant properties | ||||||
|---|---|---|---|---|---|---|---|
| Quadrant | DetID | PixID | Counts | Sigma | Mean | Median | Sigma |
| A | 14 | 238 | 530619 | 632.03 | 3794 | 3716 | 833.7 |
| A | 4 | 2 | 322510 | 382.4 | 3794 | 3716 | 833.7 |
| A | 10 | 253 | 85775 | 98.43 | 3794 | 3716 | 833.7 |
| B | 7 | 220 | 1002669 | 1371.36 | 3821 | 3731 | 728.4 |
| B | 0 | 198 | 263193 | 356.2 | 3821 | 3731 | 728.4 |
| B | 0 | 197 | 179324 | 241.06 | 3821 | 3731 | 728.4 |
| C | 3 | 233 | 469921 | 557.36 | 3608 | 3600 | 836.7 |
| C | 1 | 16 | 55209 | 61.68 | 3608 | 3600 | 836.7 |
| C | 9 | 54 | 51547 | 57.31 | 3608 | 3600 | 836.7 |
| D | 1 | 52 | 3711418 | 4416.53 | 3670 | 3547 | 839.5 |
| D | 7 | 38 | 822540 | 975.52 | 3670 | 3547 | 839.5 |
| D | 7 | 238 | 336916 | 397.08 | 3670 | 3547 | 839.5 |
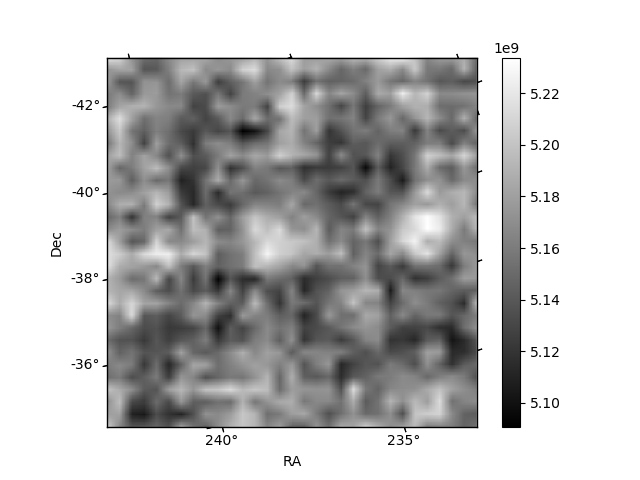
Histogram calculated using DETX and DETY for each event in the final _common_clean file
| Quadrant A |  |
 |
Quadrant B |
|---|---|---|---|
| Quadrant D |  |
 |
Quadrant C |
| Plot type | Count rate plots | Images |
|---|---|---|
| Comparison with Poisson distribution Blue bars denote a histogram of data divided into 1 sec bins. Red curve is a Poisson curve with rate = median count rate of data. |
 |
 |
| Quadrant-wise count rates Data is divided into 100 sec bins |
 |
|
| Module-wise count rates for Quadrant A Data is divided into 100 sec bins |
 |
 |
| Module-wise count rates for Quadrant B Data is divided into 100 sec bins |
 |
 |
| Module-wise count rates for Quadrant C Data is divided into 100 sec bins |
 |
 |
| Module-wise count rates for Quadrant D Data is divided into 100 sec bins |
 |
 |
| Parameter | Plot |
|---|---|
| CZT HV Monitor |  |
| D_VDD |  |
| Temperature 1 |  |
| Veto HV Monitor |  |
| Veto LLD |  |
| Alpha Counter |  |
| _CPM_Rate |  |
| CZT Counter |  |
| +2.5 Volts monitor |  |
| +5 Volts monitor |  |
| _ROLL_ROT |  |
| _Roll_DEC | 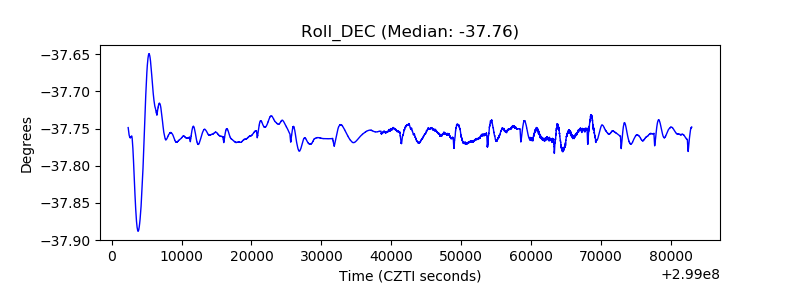 |
| _Roll_RA |  |
| Veto Counter | 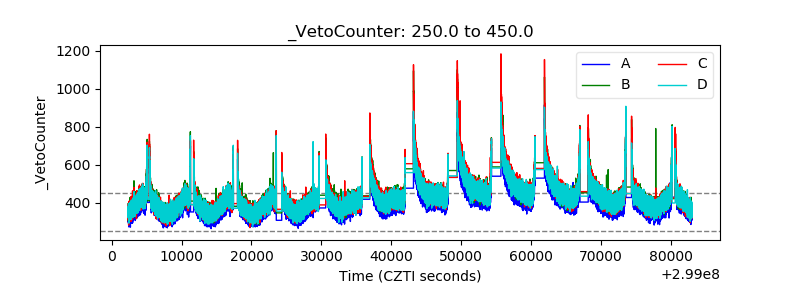 |