| Param | Original file | Final file |
|---|---|---|
| Filename | modeM0/AS1A05_180T01_9000002992cztM0_level2_bc.evt | modeM0/AS1A05_180T01_9000002992cztM0_level2_quad_clean.evt |
| Size (bytes) | 18,573,327,360 | 6,096,358,080 |
| Size | 17.3 GB | 5.7 GB |
| Events in quadrant A | 131,326,950 | 38,803,588 |
| Events in quadrant B | 133,450,334 | 40,201,184 |
| Events in quadrant C | 102,791,779 | 38,868,927 |
| Events in quadrant D | 166,001,585 | 37,659,273 |
| Mode M9 | |||
|---|---|---|---|
| Quadrant | BADHDUFLAG | Total packets | Discarded packets |
| A | 0 | 709 | 0 |
| B | 0 | 709 | 0 |
| C | 0 | 709 | 0 |
| D | 0 | 709 | 0 |
| Mode M0 | |||
|---|---|---|---|
| Quadrant | BADHDUFLAG | Total packets | Discarded packets |
| A | 0 | 1116323 | 0 |
| B | 0 | 1036290 | 0 |
| C | 0 | 930373 | 0 |
| D | 0 | 1152505 | 0 |
| Mode SS | |||
|---|---|---|---|
| Quadrant | BADHDUFLAG | Total packets | Discarded packets |
| A | 0 | 8666 | 0 |
| B | 0 | 8666 | 0 |
| C | 0 | 8666 | 0 |
| D | 0 | 8666 | 0 |
| Quadrant | Total seconds | Saturated seconds | Saturation percentage |
|---|---|---|---|
| A | 425212 | 34207 | 8.044693% |
| B | 425213 | 18207 | 4.281854% |
| C | 425213 | 8582 | 2.018283% |
| D | 425213 | 25941 | 6.100707% |
Noise dominated data is calculated using 1-second bins in cleaned event files. If a bin has >2000 counts, and if more than 50% of those come from <1% of pixels, then it is considered to be noise-dominated and hence unusable.
| Quadrant | # 1 sec bins | Bins with >0 counts | Bins with >2000 counts | High rate bins dominated by noise | Noise dominated (total time) | Noise dominated (detector-on time) | Marked lightcurve |
|---|---|---|---|---|---|---|---|
| A | 543476 | 425133 | 539 | 539 | 0.10% | 0.13% |  |
| B | 543476 | 425213 | 2241 | 2241 | 0.41% | 0.53% |  |
| C | 543476 | 425224 | 58 | 58 | 0.01% | 0.01% |  |
| D | 543476 | 425207 | 5635 | 5635 | 1.04% | 1.33% | 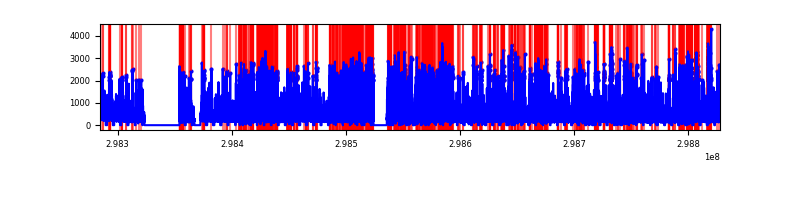 |
Top three noisy pixels from each quadrant. If the there are fewer than three noisy pixels in the level2.evt file, extra rows are filled as -1
| Pixel properties | Quadrant properties | ||||||
|---|---|---|---|---|---|---|---|
| Quadrant | DetID | PixID | Counts | Sigma | Mean | Median | Sigma |
| A | 14 | 238 | 32595558 | 6120.66 | 24163 | 23794 | 5321.6 |
| A | 14 | 254 | 4158874 | 777.04 | 24163 | 23794 | 5321.6 |
| A | 15 | 192 | 428216 | 76.0 | 24163 | 23794 | 5321.6 |
| B | 10 | 245 | 32925262 | 6952.34 | 24704 | 24308 | 4732.4 |
| B | 4 | 80 | 1616838 | 336.52 | 24704 | 24308 | 4732.4 |
| B | 0 | 198 | 1039136 | 214.44 | 24704 | 24308 | 4732.4 |
| C | 3 | 233 | 9225741 | 1647.47 | 23692 | 23801 | 5585.5 |
| C | 4 | 254 | 1986108 | 351.32 | 23692 | 23801 | 5585.5 |
| C | 8 | 208 | 348599 | 58.15 | 23692 | 23801 | 5585.5 |
| D | 1 | 52 | 53007081 | 9341.87 | 24016 | 23294 | 5671.6 |
| D | 7 | 238 | 6569252 | 1154.15 | 24016 | 23294 | 5671.6 |
| D | 12 | 218 | 3841192 | 673.16 | 24016 | 23294 | 5671.6 |
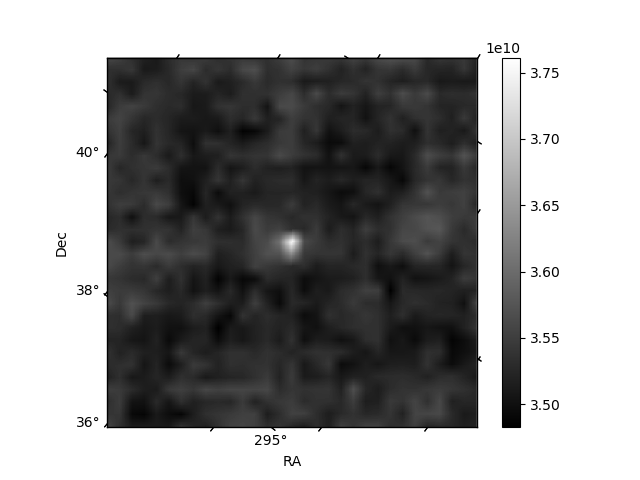
Histogram calculated using DETX and DETY for each event in the final _common_clean file
| Quadrant A |  |
 |
Quadrant B |
|---|---|---|---|
| Quadrant D |  |
 |
Quadrant C |
| Plot type | Count rate plots | Images |
|---|---|---|
| Comparison with Poisson distribution Blue bars denote a histogram of data divided into 1 sec bins. Red curve is a Poisson curve with rate = median count rate of data. |
 |
 |
| Quadrant-wise count rates Data is divided into 100 sec bins |
 |
|
| Module-wise count rates for Quadrant A Data is divided into 100 sec bins |
 |
 |
| Module-wise count rates for Quadrant B Data is divided into 100 sec bins |
 |
 |
| Module-wise count rates for Quadrant C Data is divided into 100 sec bins |
 |
 |
| Module-wise count rates for Quadrant D Data is divided into 100 sec bins |
 |
 |
| Parameter | Plot |
|---|---|
| CZT HV Monitor | 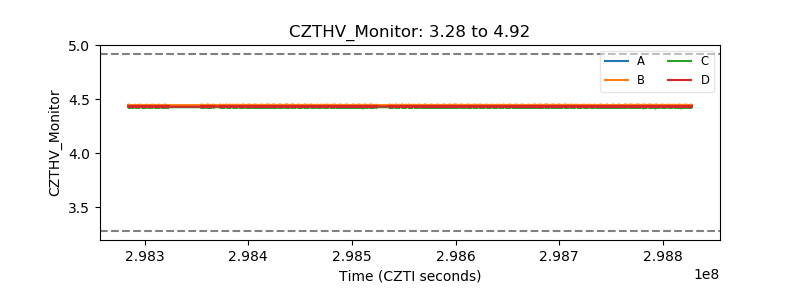 |
| D_VDD | 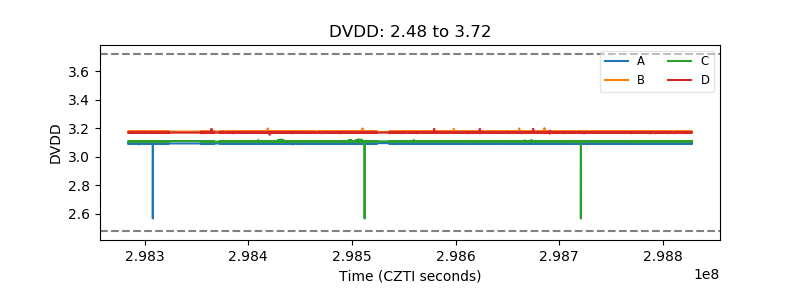 |
| Temperature 1 | 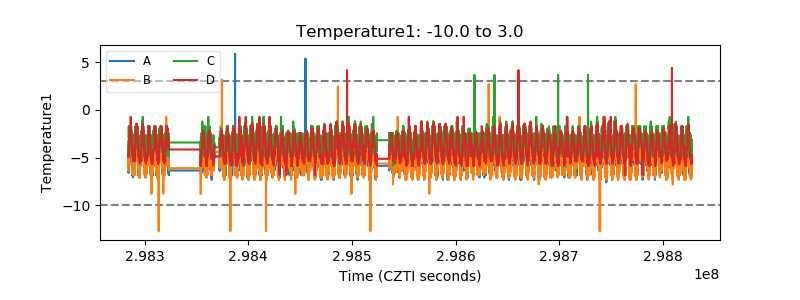 |
| Veto HV Monitor |  |
| Veto LLD |  |
| Alpha Counter | 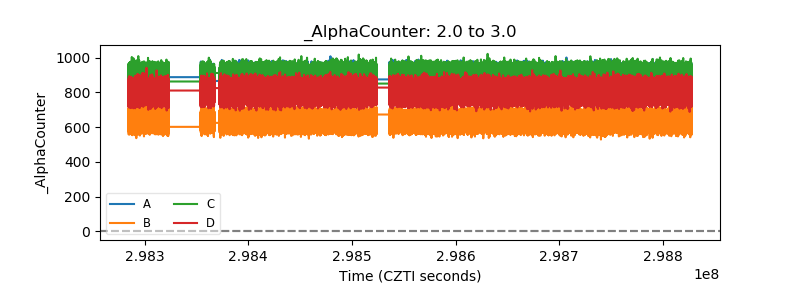 |
| _CPM_Rate | 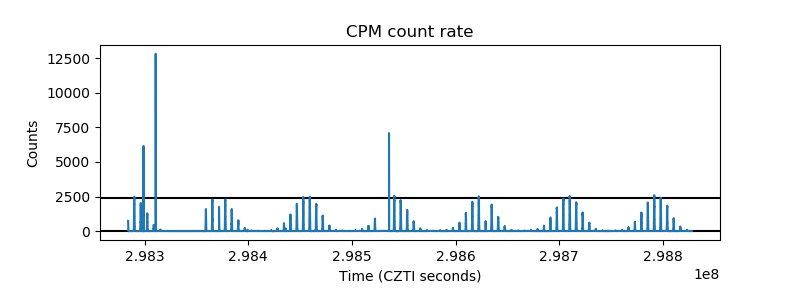 |
| CZT Counter |  |
| +2.5 Volts monitor |  |
| +5 Volts monitor |  |
| _ROLL_ROT |  |
| _Roll_DEC |  |
| _Roll_RA | 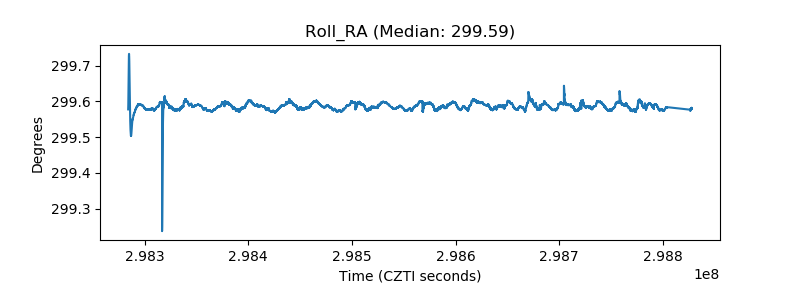 |
| Veto Counter |  |