| Param | Original file | Final file |
|---|---|---|
| Filename | modeM0/AS1T03_120T01_9000002990cztM0_level2_bc.evt | modeM0/AS1T03_120T01_9000002990cztM0_level2_quad_clean.evt |
| Size (bytes) | 2,583,622,080 | 1,019,635,200 |
| Size | 2.4 GB | 972.4 MB |
| Events in quadrant A | 15,908,789 | 6,964,340 |
| Events in quadrant B | 15,684,220 | 7,019,495 |
| Events in quadrant C | 11,946,589 | 6,777,425 |
| Events in quadrant D | 30,964,424 | 6,352,977 |
| Mode SS | |||
|---|---|---|---|
| Quadrant | BADHDUFLAG | Total packets | Discarded packets |
| A | 0 | 1116 | 0 |
| B | 0 | 1116 | 0 |
| C | 0 | 1116 | 0 |
| D | 0 | 1116 | 0 |
| Mode M9 | |||
|---|---|---|---|
| Quadrant | BADHDUFLAG | Total packets | Discarded packets |
| A | 0 | 63 | 0 |
| B | 0 | 63 | 0 |
| C | 0 | 63 | 0 |
| D | 0 | 63 | 0 |
| Mode M0 | |||
|---|---|---|---|
| Quadrant | BADHDUFLAG | Total packets | Discarded packets |
| A | 0 | 131911 | 0 |
| B | 0 | 126728 | 0 |
| C | 0 | 113922 | 0 |
| D | 0 | 177070 | 0 |
| Quadrant | Total seconds | Saturated seconds | Saturation percentage |
|---|---|---|---|
| A | 54973 | 2395 | 4.356684% |
| B | 54973 | 1186 | 2.157423% |
| C | 54973 | 652 | 1.186037% |
| D | 54973 | 4620 | 8.404126% |
Noise dominated data is calculated using 1-second bins in cleaned event files. If a bin has >2000 counts, and if more than 50% of those come from <1% of pixels, then it is considered to be noise-dominated and hence unusable.
| Quadrant | # 1 sec bins | Bins with >0 counts | Bins with >2000 counts | High rate bins dominated by noise | Noise dominated (total time) | Noise dominated (detector-on time) | Marked lightcurve |
|---|---|---|---|---|---|---|---|
| A | 60852 | 54971 | 95 | 95 | 0.16% | 0.17% |  |
| B | 60852 | 54973 | 96 | 96 | 0.16% | 0.17% | 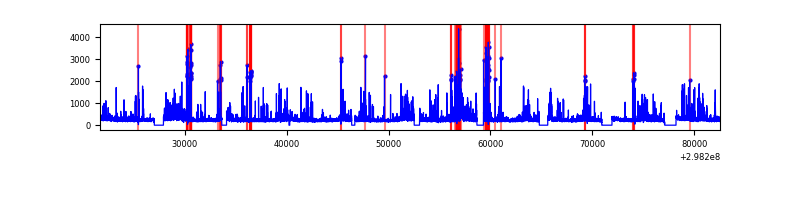 |
| C | 60852 | 54974 | 0 | 0 | 0.00% | 0.00% |  |
| D | 60852 | 54972 | 1242 | 1242 | 2.04% | 2.26% |  |
Top three noisy pixels from each quadrant. If the there are fewer than three noisy pixels in the level2.evt file, extra rows are filled as -1
| Pixel properties | Quadrant properties | ||||||
|---|---|---|---|---|---|---|---|
| Quadrant | DetID | PixID | Counts | Sigma | Mean | Median | Sigma |
| A | 14 | 238 | 2314388 | 3169.84 | 3142 | 3062 | 729.2 |
| A | 14 | 254 | 805372 | 1100.32 | 3142 | 3062 | 729.2 |
| A | 5 | 16 | 380005 | 516.95 | 3142 | 3062 | 729.2 |
| B | 10 | 245 | 974446 | 1516.04 | 3177 | 3123 | 640.7 |
| B | 7 | 220 | 697373 | 1083.59 | 3177 | 3123 | 640.7 |
| B | 4 | 80 | 648560 | 1007.4 | 3177 | 3123 | 640.7 |
| C | 3 | 233 | 105543 | 139.73 | 3040 | 3051 | 733.5 |
| C | 4 | 254 | 72096 | 94.13 | 3040 | 3051 | 733.5 |
| C | 4 | 175 | 44244 | 56.16 | 3040 | 3051 | 733.5 |
| D | 1 | 52 | 10154704 | 13788.48 | 3012 | 2896 | 736.3 |
| D | 7 | 38 | 5518059 | 7490.85 | 3012 | 2896 | 736.3 |
| D | 12 | 218 | 2810736 | 3813.69 | 3012 | 2896 | 736.3 |
Histogram calculated using DETX and DETY for each event in the final _common_clean file
| Quadrant A |  |
 |
Quadrant B |
|---|---|---|---|
| Quadrant D |  |
 |
Quadrant C |
| Plot type | Count rate plots | Images |
|---|---|---|
| Comparison with Poisson distribution Blue bars denote a histogram of data divided into 1 sec bins. Red curve is a Poisson curve with rate = median count rate of data. |
 |
 |
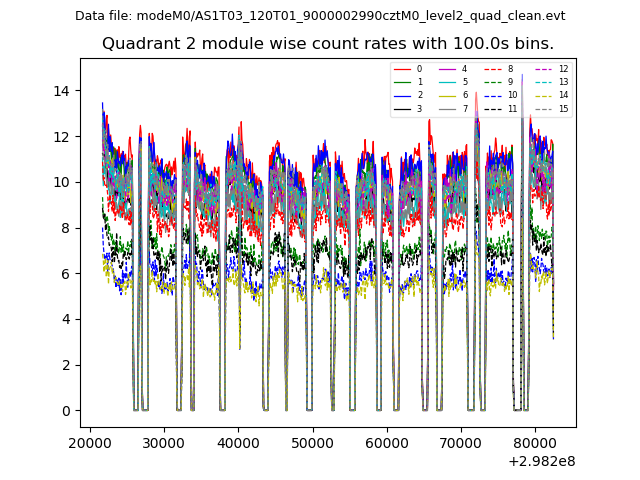
| Quadrant-wise count rates Data is divided into 100 sec bins |
 |
|
| Module-wise count rates for Quadrant A Data is divided into 100 sec bins |
 |
 |
| Module-wise count rates for Quadrant B Data is divided into 100 sec bins |
 |
 |
| Module-wise count rates for Quadrant C Data is divided into 100 sec bins |
 |
 |
| Module-wise count rates for Quadrant D Data is divided into 100 sec bins |
 |
 |
| Parameter | Plot |
|---|---|
| CZT HV Monitor |  |
| D_VDD | 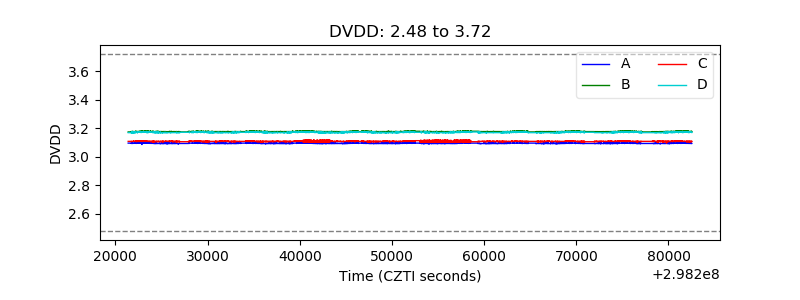 |
| Temperature 1 | 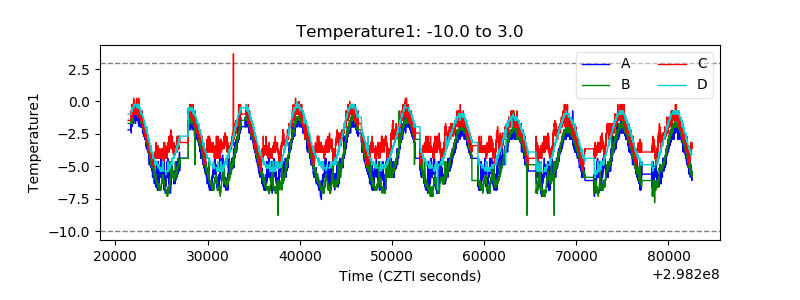 |
| Veto HV Monitor |  |
| Veto LLD |  |
| Alpha Counter |  |
| _CPM_Rate |  |
| CZT Counter | 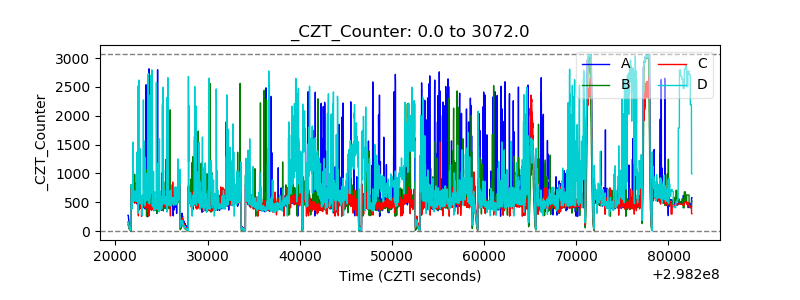 |
| +2.5 Volts monitor |  |
| +5 Volts monitor |  |
| _ROLL_ROT |  |
| _Roll_DEC |  |
| _Roll_RA |  |
| Veto Counter |  |