| Param | Original file | Final file |
|---|---|---|
| Filename | modeM0/AS1T03_117T01_9000002988cztM0_level2_bc.evt | modeM0/AS1T03_117T01_9000002988cztM0_level2_quad_clean.evt |
| Size (bytes) | 2,677,127,040 | 1,059,215,040 |
| Size | 2.5 GB | 1010.1 MB |
| Events in quadrant A | 18,563,731 | 6,840,887 |
| Events in quadrant B | 18,007,672 | 6,873,583 |
| Events in quadrant C | 16,602,574 | 6,540,862 |
| Events in quadrant D | 22,604,210 | 6,498,054 |
| Mode M9 | |||
|---|---|---|---|
| Quadrant | BADHDUFLAG | Total packets | Discarded packets |
| A | 0 | 123 | 0 |
| B | 0 | 123 | 0 |
| C | 0 | 123 | 0 |
| D | 0 | 123 | 0 |
| Mode M0 | |||
|---|---|---|---|
| Quadrant | BADHDUFLAG | Total packets | Discarded packets |
| A | 0 | 170226 | 0 |
| B | 0 | 166993 | 0 |
| C | 0 | 164376 | 0 |
| D | 0 | 180727 | 0 |
| Mode SS | |||
|---|---|---|---|
| Quadrant | BADHDUFLAG | Total packets | Discarded packets |
| A | 0 | 1582 | 0 |
| B | 0 | 1582 | 0 |
| C | 0 | 1582 | 0 |
| D | 0 | 1582 | 0 |
| Quadrant | Total seconds | Saturated seconds | Saturation percentage |
|---|---|---|---|
| A | 77743 | 1415 | 1.820100% |
| B | 77743 | 1288 | 1.656741% |
| C | 77743 | 1363 | 1.753213% |
| D | 77743 | 1411 | 1.814954% |
Noise dominated data is calculated using 1-second bins in cleaned event files. If a bin has >2000 counts, and if more than 50% of those come from <1% of pixels, then it is considered to be noise-dominated and hence unusable.
| Quadrant | # 1 sec bins | Bins with >0 counts | Bins with >2000 counts | High rate bins dominated by noise | Noise dominated (total time) | Noise dominated (detector-on time) | Marked lightcurve |
|---|---|---|---|---|---|---|---|
| A | 90113 | 77742 | 9 | 9 | 0.01% | 0.01% |  |
| B | 90113 | 77743 | 39 | 39 | 0.04% | 0.05% |  |
| C | 90113 | 77744 | 7 | 7 | 0.01% | 0.01% |  |
| D | 90113 | 77744 | 183 | 183 | 0.20% | 0.24% |  |
Top three noisy pixels from each quadrant. If the there are fewer than three noisy pixels in the level2.evt file, extra rows are filled as -1
| Pixel properties | Quadrant properties | ||||||
|---|---|---|---|---|---|---|---|
| Quadrant | DetID | PixID | Counts | Sigma | Mean | Median | Sigma |
| A | 14 | 238 | 952743 | 993.63 | 4406 | 4339 | 954.5 |
| A | 14 | 254 | 560826 | 583.03 | 4406 | 4339 | 954.5 |
| A | 11 | 29 | 74729 | 73.75 | 4406 | 4339 | 954.5 |
| B | 10 | 245 | 500877 | 606.02 | 4413 | 4317 | 819.4 |
| B | 4 | 80 | 273589 | 328.63 | 4413 | 4317 | 819.4 |
| B | 0 | 198 | 119405 | 140.46 | 4413 | 4317 | 819.4 |
| C | 4 | 254 | 296077 | 298.91 | 4206 | 4195 | 976.5 |
| C | 3 | 233 | 67745 | 65.08 | 4206 | 4195 | 976.5 |
| C | 4 | 175 | 31814 | 28.28 | 4206 | 4195 | 976.5 |
| D | 1 | 52 | 3892927 | 3936.15 | 4328 | 4190 | 988.0 |
| D | 2 | 184 | 1170221 | 1180.25 | 4328 | 4190 | 988.0 |
| D | 2 | 234 | 313506 | 313.09 | 4328 | 4190 | 988.0 |
Histogram calculated using DETX and DETY for each event in the final _common_clean file
| Quadrant A |  |
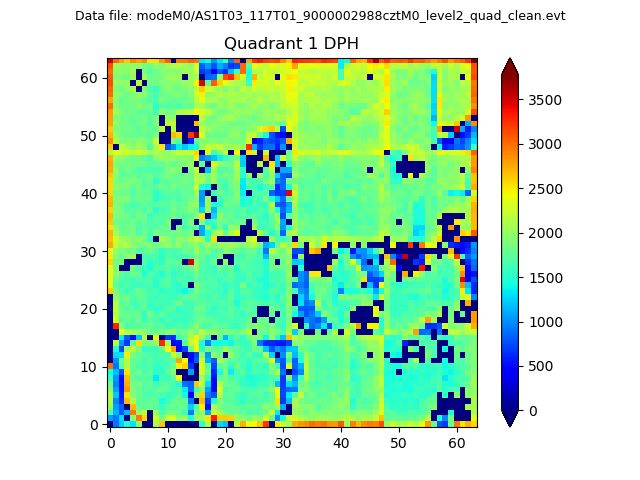 |
Quadrant B |
|---|---|---|---|
| Quadrant D |  |
 |
Quadrant C |
| Plot type | Count rate plots | Images |
|---|---|---|
| Comparison with Poisson distribution Blue bars denote a histogram of data divided into 1 sec bins. Red curve is a Poisson curve with rate = median count rate of data. |
 |
 |
| Quadrant-wise count rates Data is divided into 100 sec bins |
 |
|
| Module-wise count rates for Quadrant A Data is divided into 100 sec bins |
 |
 |
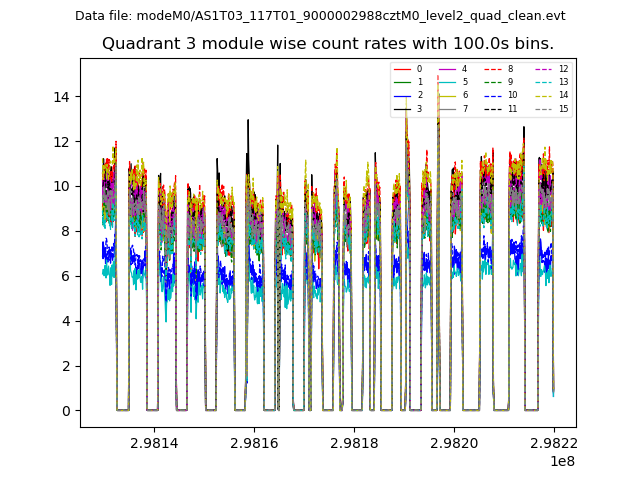
| Module-wise count rates for Quadrant B Data is divided into 100 sec bins |
 |
 |
| Module-wise count rates for Quadrant C Data is divided into 100 sec bins |
 |
 |
| Module-wise count rates for Quadrant D Data is divided into 100 sec bins |
 |
 |
| Parameter | Plot |
|---|---|
| CZT HV Monitor | 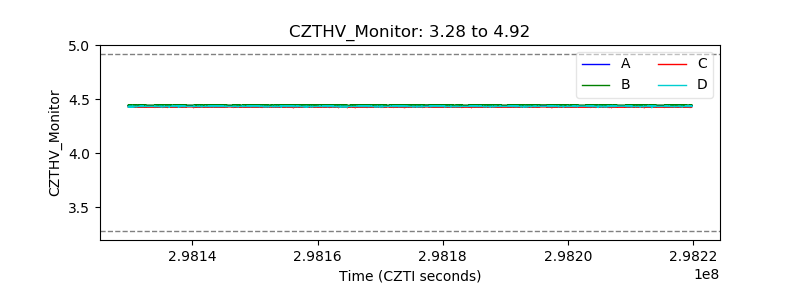 |
| D_VDD |  |
| Temperature 1 |  |
| Veto HV Monitor |  |
| Veto LLD |  |
| Alpha Counter | 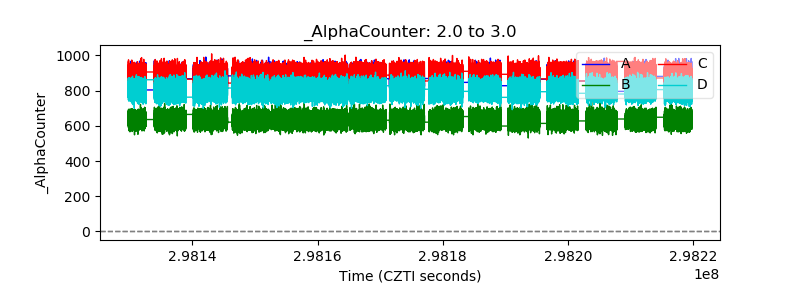 |
| _CPM_Rate |  |
| CZT Counter | 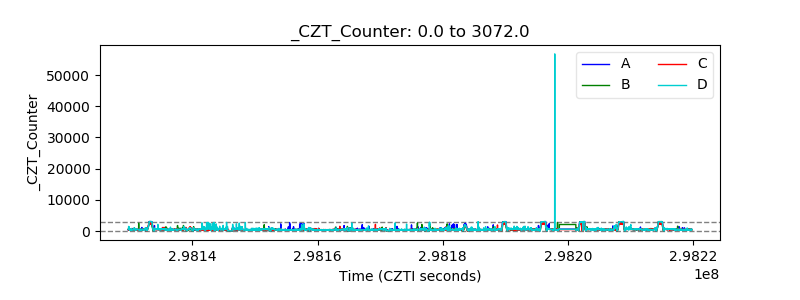 |
| +2.5 Volts monitor |  |
| +5 Volts monitor |  |
| _ROLL_ROT |  |
| _Roll_DEC |  |
| _Roll_RA |  |
| Veto Counter |  |